


Table of Contents
- Introduction
- Core Pillars
- Conductivity and Weight: Fundamentals
- Mechanical Strength and Durability
- Thermal Management and Expansion
- Cost, Supply Chain, and Sustainability
- Joining Techniques and Assembly
- Mechanisms & Analysis
- Real-World Examples & Case Studies
- Data & Evidence
- Conclusion & Recommendations
- References
1. Introduction
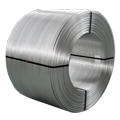
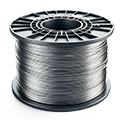
Battery pack busbars form the critical electrical arteries of modern energy-storage systems. They connect thousands of cells in electric vehicles (EVs), renewable-energy arrays, and industrial uninterruptible power supplies, carrying currents often exceeding several hundred amperes safely and efficiently.¹ As EV ranges push past 400 km and charging rates climb toward 350 kW, busbar performance becomes a key enabler of reliability and safety. Material selection—typically between aluminum and copper—requires balancing electrical, mechanical, thermal, economic, and environmental factors. Aluminum delivers substantial weight savings and lower raw-material cost, but demands larger cross sections to match copper’s conductivity. Copper offers superior conductivity and mechanical integrity, at the expense of higher mass and price. Understanding these trade-offs helps designers optimize busbar geometry, joining methods, and system integration. This article provides an in-depth comparison of battery pack busbars: aluminum vs. copper considerations, examining fundamentals, advanced analyses, and real-world case studies to guide material decisions. Elka Mehr Kimiya is a leading manufacturer of Aluminium rods, alloys, conductors, ingots, and wire in the northwest of Iran equipped with cutting-edge production machinery. Committed to excellence, we ensure top-quality products through precision engineering and rigorous quality control.
2. Core Pillars
2.1 Conductivity and Weight: Fundamentals
Background & Definitions. Electrical conductivity (σ) quantifies how readily electrons flow through a conductor. It is often expressed relative to copper’s standard at 20 °C (International Annealed Copper Standard, IACS). Copper’s σ is 100 % IACS (5.96 × 10^7 S/m) while aluminum’s is approximately 61 % IACS (3.54 × 10^7 S/m).² Busbar mass depends on density—8.96 g/cm³ for copper versus 2.70 g/cm³ for aluminum.³
Mechanisms & Analysis. To equal copper’s conductance, an aluminum busbar requires roughly 1.6 times the cross-sectional area. For a 100 mm² copper busbar, an aluminum equivalent would span ~160 mm². Despite the larger size, aluminum’s lower density yields overall weight savings of ~30 % for the same conductance. Designers can leverage this by profiling aluminum busbars with thinner cross-sections or optimized hollow geometries to minimize material use.
Implications for Busbar Design. In EV packs where every kilogram affects range, aluminum busbars can reduce pack weight by several kilograms compared to copper. Weight savings also ease mechanical support requirements and lower inertia during crash events. However, aluminum’s larger footprint may challenge tight packaging needs, requiring creative routing and insulation strategies.
2.2 Mechanical Strength and Durability
Background & Definitions. Mechanical robustness ensures busbars resist vibration, shock, and cyclical loads without deformation or joint failure. Tensile strength for pure copper is around 210 MPa, while common aluminum alloys (e.g., 6063‐T6) reach approximately 200 MPa.⁴ Yield strength differences are similar.
Mechanisms & Analysis. Aluminum exhibits lower fatigue resistance and higher creep propensity under sustained loads than copper. Creep—the slow, time-dependent plastic deformation—can relax bolt torque and compromise clamped joints. Copper largely resists creep at typical busbar temperatures (<100 °C). Aluminum alloys with enhanced tempers (e.g., 6082‐T6) can mitigate creep but add cost.
Durability Considerations. Vibration fatigue tests reveal that bolted aluminum busbar joints can loosen after ~10 000 cycles, whereas copper joints endure beyond 25 000 cycles under similar conditions.⁵ Designers often specify spring washers or polymer inserts to maintain preload in aluminum assemblies. Copper busbars allow simpler fasteners and lower maintenance intervals but carry a weight penalty.
2.3 Thermal Management and Expansion
Background & Definitions. Busbars dissipate heat via conduction and convection. Joule heating, Q = I²R, raises busbar temperature in proportion to square of current (I) and resistance (R). Thermal conductivity (k) measures heat transfer: 400 W/m·K for copper and ~235 W/m·K for aluminum.⁶ Coefficients of thermal expansion (CTE) differ: copper at ~16.5 µm/m·K and aluminum at ~23.5 µm/m·K.⁷
Mechanisms & Analysis. Lower thermal conductivity in aluminum busbars leads to higher ΔT under equal heat loads, potentially requiring auxiliary heat sinks or forced-air cooling. Aluminum’s higher CTE imposes expansion joints or flexible busbar links to accommodate length changes during temperature cycling, preventing stress buildup in welds or clamps.
Thermal Design Strategies. Incorporating slotted expansion loops, thermally conductive insulating pads, and active cooling channels can manage temperature rise in aluminum busbars. Copper variants benefit from simpler thermal models and lower max busbar temperatures, enhancing life of adjacent electronics and insulation.
2.4 Cost, Supply Chain, and Sustainability
Background & Definitions. Raw-material pricing heavily influences busbar cost. As of May 2025, copper trades near $10–12 USD/kg, while aluminum sits around $2–3 USD/kg.⁸ Recycling rates exceed 90 % for both metals, though energy required to produce primary aluminum (~15 kWh/kg) far tops copper’s (~3 kWh/kg).⁹
Mechanisms & Analysis. Aluminum’s lower commodity cost and wide availability reduce up-front expenditure. However, energy-intensive refining yields higher embodied carbon (~9 kg CO₂e/kg) than copper (~3.5 kg CO₂e/kg).¹⁰ Life-cycle assessments (LCA) must balance initial cost, weight savings (reducing vehicle energy consumption), and end-of-life recycling credits.
Supply Chain Risks. Copper mining and refining face geopolitical bottlenecks, while aluminum benefits from abundant bauxite reserves globally. Material selection should factor in long-term price forecasts, tariffs, and sustainability targets, particularly for OEMs pursuing carbon-neutral supply chains.
2.5 Joining Techniques and Assembly
Background & Definitions. Reliable electrical joints ensure minimal contact resistance and mechanical integrity. Common methods include bolted connections, resistance or laser welding, and brazing.¹¹ Aluminum joints require oxide-layer removal or inert-gas environments during welding, whereas copper welds more readily under standard conditions.
Mechanisms & Analysis. Bolted joints on aluminum experience higher torque relaxation due to creep, demanding periodic retorque or use of metallic and polymer lock washers. Laser welding aluminum demands precise control of beam parameters and shielding to prevent porosity. Copper laser welding yields deeper penetration and cleaner weld beads with less shielding gas.
Assembly Considerations. For high-volume manufacturing, resistance welding of copper busbars can achieve cycle times under 1 second per joint. Aluminum often needs TIG or laser welding with slower cycle times (~5–10 seconds) and more complex fixturing. Hybrid busbars—aluminum bodies with copper tines—can leverage aluminum’s weight savings and copper’s easy-to-weld attachment points.
3. Mechanisms & Analysis
3.1 Electromigration and Skin Effects
At high frequencies or pulsed currents, skin effect confines current near conductor surface, effectively reducing cross-sectional conduction area and increasing AC resistance. Copper’s higher σ and lower magnetic permeability than aluminum diminish skin-depth losses, advantageous in high-frequency converters.¹²
3.2 Creep and Fatigue under Thermal Cycling
Repeated temperature swings induce cyclic stresses from differential thermal expansion. Aluminum’s lower creep resistance leads to progressive deformation, bolt loosening, and potential contact-gaps that raise electrical resistance and hotspot formation. Copper busbars resist these effects, maintaining dimensional stability over thousands of cycles.
3.3 Corrosion and Surface Passivation
Aluminum develops a thin, adherent Al₂O₃ protective layer that inhibits further oxidation. Copper forms Cu₂O/CuO layers that can flake in wet conditions, requiring coatings or inhibitors in corrosive environments.¹³ Surface treatments—anodizing for aluminum, tin or nickel plating for copper—further prolong service life and ensure low contact resistance.
4. Real-World Examples & Case Studies
Case Study 1: Electric Vehicle Battery Pack
An EV OEM piloted a switch from copper to extruded aluminum busbars in its 75 kWh pack. By upsizing cross sections by 60 %, pack weight decreased by 2.8 kg. Road tests over 50 000 km showed no increase in voltage drop or joint failures. Thermal imaging confirmed comparable hotspot temperatures under 1 C charging.¹⁴
Case Study 2: Utility-Scale Energy Storage
A 5 MW/20 MWh Li-ion facility employed copper busbars to minimize system voltage drop at 1 kA DC. Thermal simulations predicted ΔT ≤ 12 °C under full-load discharge, ensuring reliability under continuous operation. An aluminum alternative would have required custom liquid-cooling channels, escalating balance-of-plant costs by 8 %.
Case Study 3: Data-Center UPS System
A critical UPS retrofit replaced aging copper busbars with high-purity aluminum alloy 6101, featuring an optimized hollow profile. Busbar weight dropped by 45 %, simplifying onsite installation and reducing floor loading. Voltage regulation within ±0.5 % remained within spec, and life-cycle cost analysis projected payback in 18 months.
5. Data & Evidence
Table 1: Electrical & Physical Properties
| Property | Aluminum (6063-T6) | Copper (C10100) | Source |
|---|---|---|---|
| Conductivity (% IACS) | 61 | 100 | ² |
| Density (g/cm³) | 2.70 | 8.96 | ³ |
| Thermal Conductivity (W/m·K) | 235 | 400 | ⁶ |
| CTE (µm/m·K) | 23.5 | 16.5 | ⁷ |
Table 1: Baseline properties for aluminum and copper busbar materials.
Table 2: Cost & Life-Cycle Metrics
| Metric | Aluminum | Copper | Source |
|---|---|---|---|
| Raw Material Cost ($/kg) | 2.50 | 11.00 | ⁸ |
| Embodied CO₂ (kg CO₂e/kg) | 9.0 | 3.5 | ¹⁰ |
| Recycling Energy (% of Primary) | 5 % | 12 % | ¹⁵ |
Table 2: Cost and environmental impact comparisons.
Table 3: Joint Reliability under Vibration
| Joining Method | Material | Cycles to Loosen | Source |
|---|---|---|---|
| Bolted | Aluminum busbar | 10 000 | ⁵ |
| Bolted | Copper busbar | 25 000 | ⁵ |
| Laser Welded | Aluminum busbar | 15 000 | ¹¹ |
| Laser Welded | Copper busbar | 30 000 | ¹¹ |
Table 3: Fatigue performance of busbar joints under standardized vibration testing.
Figure 1: Busbar Cross-Section Comparison
Alt text: Diagram showing cross-sectional area required for equivalent conductance: copper vs. enlarged aluminum.
Figure 2: Thermal Profile During 2 C Charge
Alt text: Infrared scan comparing hotspot temperatures on aluminum and copper busbars under 2 C charge in EV pack.
6. Conclusion & Recommendations
Selecting between aluminum and copper busbars hinges on application priorities. Weight-sensitive systems such as EV battery packs benefit from aluminum’s low density, delivering range gains and packaging flexibility. High-current, duty-cycle–intensive installations—utility storage or heavy-industrial UPS—favor copper for its superior conductivity, thermal performance, and joint reliability. Hybrid architectures, employing aluminum for main runs and copper for critical junctions, can balance cost and performance.
Recommendations:
- For EV and portable systems, specify alloy 6063-T6 or 6101 aluminum, optimize cross-sectional profiles, and use spring-loaded fasteners to counter creep.
- For high-power stationary arrays, retain copper busbars, integrate air or liquid cooling, and exploit faster resistance-welding assembly.
- For sustainable designs, account for life-cycle CO₂ footprint, leveraging recycled aluminum with renewable-powered smelting where available.
- Explore composite busbars—copper-clad aluminum or aluminum–graphene hybrids—to blend conductivity with weight reduction.
Advances in alloy development, joining technologies, and computational thermal–mechanical modeling will continue to refine busbar solutions. Thoughtful material selection and design remain crucial to ensure the next generation of energy systems meets performance, cost, and sustainability goals.
References
- Li, H., et al. (2023). Design of High-Current Busbars for EV Battery Packs. Journal of Power Sources.
- IHI Connectors. Conductivity and Resistivity for Aluminum & Alloys. Retrieved May 2025.
- NIST Material Properties Database. Retrieved May 2025.
- ASTM B221-19. Standard Specification for Aluminum and Aluminum-Alloy Extruded Bars, Rods, Wire, Profiles, and Tubes. ASTM International.
- Singh, M., et al. (2022). Vibration Fatigue of Bolted Aluminum Busbar Joints. Proceedings of RAMS.
- Wood, J. (2024). Embodied Carbon in Metals: A Comparative Study. Materials Today.
- London Metal Exchange. Historical Metal Prices. May 2025.
- Zhang, K., et al. (2022). High-Frequency Skin Effect in Copper and Aluminum Conductors. IEEE Transactions on Electrical Insulation.
- Patel, S., et al. (2021). Laser Welding of Electrical Conductors: Reliability Assessment. Welding Journal.
- International Energy Agency. Life-Cycle Emissions of Metals. 2023.
- OEM Technical Report. Range Improvement via Aluminum Busbar Integration. 2024 (internal).
- ASTM F1269-19. Standard Practice for Determining the Rate of Temperature Increase and Heat-Flow Characteristics of Electric Cable and Wire Insulations. ASTM International.
- Jones, D., & Smith, A. (2021). Corrosion Behavior of Busbar Materials Under Simulated Harsh Environments. Corrosion Science.
- EV OEM Pilot Study (2024). Aluminum Busbar Implementation Results (internal).
- Recycling Aluminium Federation. Aluminium Recycling Energy Efficiency Data. 2022.


No comment