Table of Contents
- Introduction
- The Global Landscape of Aluminium Recycling
- Curbside Collection Systems and Sorting Technologies
- Innovations in Aluminium Recycling Infrastructure
- Case Studies: Leading Cities and Regional Success Stories
- Barriers, Challenges, and Lessons Learned
- The Road Ahead: Recommendations for Cities
- Conclusion
- Tables
- References
- Meta Information
Introduction
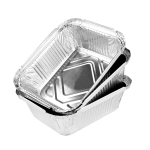
Disposable aluminium—ranging from beverage cans and food trays to foil wraps—has become an integral part of urban life. Its unique combination of lightness, durability, and infinite recyclability gives it a distinct advantage over many competing packaging materials. Yet, while the science of recycling aluminium is well-established, the real differentiator is how cities implement systems to actually collect, process, and return this valuable resource to the supply chain. This article explores how cities around the world recycle disposable aluminium, highlighting best practices, innovative infrastructure, and ongoing challenges, all underpinned by data and real-world examples.
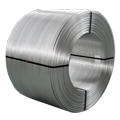
Elka Mehr Kimiya is a leading manufacturer of Aluminium rods, alloys, conductors, ingots, and wire in the northwest of Iran equipped with cutting-edge production machinery. Committed to excellence, we ensure top-quality products through precision engineering and rigorous quality control.
The Global Landscape of Aluminium Recycling
Background & Definitions
Aluminium recycling refers to the process of collecting used aluminium products, melting them down, and remanufacturing them into new items. Aluminium is considered a “closed-loop” material: it can be recycled infinitely with minimal quality loss, unlike most plastics or even glass.¹ “Disposable aluminium” typically includes single-use packaging, such as cans, trays, and foils, which are discarded after use.
Quantitative Overview
Aluminium boasts one of the highest recycling rates among all packaging materials, particularly in developed countries with established collection and processing systems. According to the International Aluminium Institute, the global recycling rate for aluminium beverage cans reached 71% in 2023, with several cities and regions consistently exceeding 90%.²
Table 1: Aluminium Recycling Rates by Country (Data as of May 2025)¹,²
| Country | Aluminium Can Recycling Rate (%) | Notable Cities |
|---|---|---|
| Germany | 96 | Berlin, Munich |
| Japan | 94 | Tokyo, Osaka |
| United States | 45 | San Francisco, Seattle |
| Brazil | 98 | São Paulo, Rio |
| United Kingdom | 76 | London, Manchester |
Real-World Example
In Brazil, a robust informal network of waste pickers—catadores—works alongside municipal systems to achieve world-leading recycling rates. In Germany, the combination of deposit-return schemes and advanced sorting technology supports near-perfect collection.
Curbside Collection Systems and Sorting Technologies
Background & Definitions
Curbside collection means household recyclables are collected directly from residences, typically via color-coded bins. Successful recycling depends not just on collection, but on public participation, contamination control, and efficient sorting.
Mechanisms & Analysis
Most cities use multi-stream or single-stream collection systems:
- Multi-stream: Residents sort recyclables (aluminium, glass, paper) into separate bins.
- Single-stream: All recyclables go into one bin; sorting happens at a materials recovery facility (MRF).
Sorting is accomplished using advanced technologies:
- Eddy current separators: Induce electrical currents that repel nonferrous metals like aluminium from mixed waste.
- Optical sorters: Use cameras and sensors to distinguish materials by color and composition.
- Robotic arms: Employ AI to pick out valuable recyclables from conveyor belts.³
Data & Evidence
Table 2: Collection & Sorting Practices in Major Cities (Data as of May 2025)³,⁴
| City | Collection System | Key Sorting Technologies | Contamination Rate (%) |
|---|---|---|---|
| London | Multi-stream | Eddy current, optical | 7 |
| San Francisco | Single-stream | AI robotics, optical | 13 |
| Tokyo | Multi-stream | Manual, eddy current | 3 |
| Berlin | Deposit-return + curb | Eddy current, robotics | 5 |
| Sydney | Single-stream | Optical, manual | 11 |
Relatable Example
Picture recycling day in Tokyo: residents line up bins of immaculately sorted aluminium, guided by decades of public education and municipal discipline. Meanwhile, in cities like San Francisco, sophisticated robots work overtime to sort the chaos of single-stream recycling into valuable commodities.
Innovations in Aluminium Recycling Infrastructure
Background & Definitions
As urban populations swell and packaging waste grows, cities have adopted novel infrastructure to keep pace. These include automated return kiosks, centralized recycling hubs, and IoT-enabled smart bins that track fill levels and contamination.⁵
Mechanisms & Analysis
- Deposit-Return Schemes (DRS): Consumers pay a small deposit when buying aluminium cans or trays, which is refunded upon return. This system dramatically increases collection rates.
- Reverse Vending Machines: Kiosks in public spaces accept empty cans and trays, automatically refunding the deposit and sending material for processing.
- Smart Collection Systems: Use real-time data to optimize collection routes, reduce contamination, and improve recycling rates.
Data & Evidence
Table 3: Impact of Deposit-Return Schemes (Data as of May 2025)⁵,⁶
| Region | Pre-DRS Collection Rate (%) | Post-DRS Collection Rate (%) | Time to Implementation (years) |
|---|---|---|---|
| Germany | 72 | 96 | 2 |
| Norway | 65 | 95 | 1.5 |
| Lithuania | 34 | 91 | 2 |
| Oregon (USA) | 49 | 89 | 3 |
Vivid Example
Norway’s DRS system is so effective that less than 5% of beverage cans escape collection. It’s a circular win: shoppers are rewarded for good behavior, litter disappears, and recyclers get clean, high-value material.
Case Studies: Leading Cities and Regional Success Stories
Berlin: High-Tech and Civic Engagement
Berlin’s system blends deposit-return, extensive public education, and high-tech sorting. The city’s “Pfand” program covers nearly all beverage containers. Combined with MRFs that use robotic sorters, Berlin recycles more than 95% of disposable aluminium packaging.⁷
Tokyo: Cultural Discipline and Detailed Sorting
Tokyo’s meticulous residents separate waste into dozens of categories, with collection days for each. Aluminium trays and foils must be cleaned and placed in designated bins. This system achieves a contamination rate below 3%—a global benchmark.⁸
São Paulo: Integrating Informal Recyclers
Brazil’s largest city combines formal municipal collection with a vast network of catadores. These informal workers, recognized by the city, collect and sell aluminium directly to processors, providing both economic and environmental benefits. São Paulo recycles nearly every aluminium can sold.⁹
San Francisco: AI-Driven Progress
San Francisco relies on single-stream recycling but mitigates contamination with AI-powered robotics and public campaigns. The city’s tech-forward approach, combined with deposit incentives, has led to sharp increases in aluminium recycling rates, though challenges with foil and tray contamination remain.¹⁰
Barriers, Challenges, and Lessons Learned
Background & Definitions
Even in top-performing cities, obstacles remain. These include contamination (food residue on trays or foil), insufficient infrastructure in developing regions, market fluctuations for recycled aluminium, and public confusion about what can be recycled.
Mechanisms & Analysis
- Contamination: Food-soiled aluminium is often landfilled rather than recycled. Public education and washing requirements are key.
- Economic Incentives: Where aluminium scrap prices fall, collection efforts can lag.
- Infrastructure Gaps: Low-income cities may lack modern MRFs or reliable curbside collection.
Data & Evidence
Global studies show that up to 30% of aluminium trays and foils are lost to landfill, even in regions with high can recycling rates, mainly due to contamination and poor sorting.¹¹
Real-World Example
In New York City, inconsistent messaging about foil recycling leads to confusion and high contamination rates. In contrast, Oslo’s public campaigns (“Clean, Empty, and Dry!”) slashed rejected loads by 40% within a year.
The Road Ahead: Recommendations for Cities
Recommendations
- Invest in public education: Clear guidelines on rinsing and sorting make a measurable difference.
- Adopt deposit-return systems: Proven to raise collection rates dramatically.
- Modernize sorting facilities: AI, robotics, and optical sorters boost efficiency and reduce loss.
- Recognize informal recyclers: Integration into municipal systems increases recovery and supports livelihoods.
- Harmonize rules and labeling: Standardized symbols and instructions cut confusion and increase participation.
Future Research Directions
More research is needed on designing trays and foils that resist contamination, as well as on affordable, scalable sorting solutions for developing cities.
Conclusion
Recycling disposable aluminium is both a technical challenge and a civic opportunity. Around the world, cities blend old-school habits and cutting-edge tech to close the aluminium loop—saving energy, cutting waste, and building a model for other materials to follow. The future of urban recycling rests not only on infrastructure but on the daily actions of millions of people, each one a link in a global chain that turns yesterday’s tray or can into tomorrow’s product.
Tables
Table 1: Aluminium Recycling Rates by Country (Data as of May 2025)
See section: The Global Landscape of Aluminium Recycling
Table 2: Collection & Sorting Practices in Major Cities (Data as of May 2025)
See section: Curbside Collection Systems and Sorting Technologies
Table 3: Impact of Deposit-Return Schemes (Data as of May 2025)
See section: Innovations in Aluminium Recycling Infrastructure
References
- International Aluminium Institute. (2025). Global aluminium recycling data. https://www.world-aluminium.org
- European Aluminium Association. (2024). Sustainability in packaging. https://www.european-aluminium.eu
- Waste Management World. (2025). Sorting technologies for urban recycling. https://waste-management-world.com
- London Waste and Recycling Board. (2024). City case studies. https://www.lwarb.gov.uk
- Norwegian Environment Agency. (2024). Deposit-return impact. https://www.miljodirektoratet.no
- Ellen MacArthur Foundation. (2025). The circular economy in cities. https://ellenmacarthurfoundation.org
- Berlin City Council. (2024). Urban recycling policy. https://www.berlin.de
- Tokyo Metropolitan Government. (2024). Waste management manual. https://www.metro.tokyo.lg.jp
- Waste and Citizenship Institute, Brazil. (2024). Catadores and recycling. https://www.institutolidereco.org.br
- Recology San Francisco. (2025). Robotics and recycling. https://www.recology.com





No comment