


In the dynamic world of finance and trading, real-time markhttps://price.chbk.app/et data is not just an advantage—it’s a necessity. Whether you’re an investor, trader, market analyst, or a business owner, having instant access to accurate and up-to-date financial information can significantly influence your decision-making process. Recognizing this critical need, Elka Mehr Kimiya proudly presents the Market Prices Dashboard—a state-of-the-art tool designed to provide comprehensive, real-time insights into key market indicators. This blog post delves deep into the features, benefits, and practical applications of our price dashboard, showcasing why it’s an indispensable asset for anyone navigating the financial landscape.
Table of Contents
- Why Real-Time Market Data Matters
- Introducing the Market Prices Dashboard
- Key Features of the Dashboard
- User Interface and Experience
- Benefits of Using the Market Prices Dashboard
- How to Get Started
- Future Enhancements
- Conclusion
- Frequently Asked Questions (FAQ)
- Optimize Your Financial Journey with the Market Prices Dashboard
Why Real-Time Market Data Matters
In today’s interconnected global economy, financial markets operate at lightning speed. Prices of commodities, currencies, and other financial instruments can fluctuate rapidly based on a myriad of factors—ranging from geopolitical events to economic indicators. For stakeholders like investors and traders, these price movements present both opportunities and risks. Access to real-time market data ensures that decisions are informed, timely, and aligned with the current market scenario.
Key Reasons Real-Time Data is Crucial:
- Informed Decision Making: Accurate data minimizes the risk of errors.
- Opportunity Identification: Spot trends and capitalize on favorable movements.
- Risk Management: Anticipate and mitigate potential losses.
- Competitive Advantage: Stay ahead of peers by being the first to act on new information.
With these points in mind, the necessity for a reliable and efficient tool to monitor and analyze market data becomes evident. This is where the Market Prices Dashboard shines.
Introducing the Market Prices Dashboard
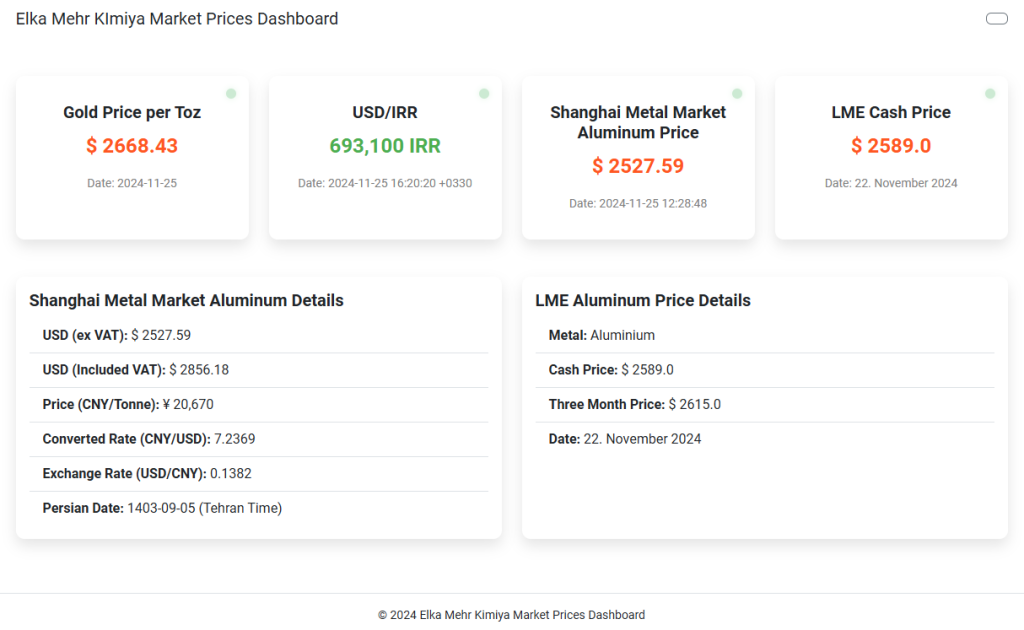
The Market Prices Dashboard by Elka Mehr Kimiya is a cutting-edge web application designed to provide users with real-time insights into essential market indicators. Developed with user experience and functionality at its core, the dashboard amalgamates data from multiple sources, presenting it in a coherent, visually appealing, and easily digestible format.
Core Objectives of the Dashboard:
- Centralized Data Access: Consolidate key market prices in one platform.
- User-Friendly Interface: Ensure ease of navigation and data interpretation.
- Real-Time Updates: Deliver the most current data to users.
- Customization: Allow users to focus on metrics that matter most to them.
Whether you’re tracking gold prices, monitoring currency exchange rates, or analyzing aluminum market trends, our dashboard serves as your one-stop solution for all your financial data needs.
Key Features of the Dashboard
The Market Prices Dashboard is packed with features tailored to provide comprehensive market insights. Below, we explore each feature in detail.
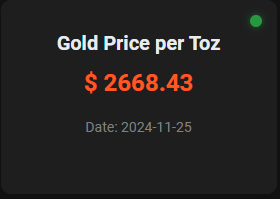
1. Gold Price per Toz
Gold has always been a symbol of wealth and a preferred investment vehicle. Monitoring its price is crucial for investors looking to hedge against inflation or diversify their portfolios.
Feature Highlights:
- Real-Time Pricing: Access the latest gold prices per toz (a traditional unit of measure).
- Historical Data: Analyze price trends over various periods.
- Date of Last Update: Stay informed about the currency of the displayed data.
Why It Matters:
Gold prices are influenced by global economic conditions, geopolitical stability, and currency fluctuations. Having up-to-the-minute data allows investors to make timely decisions, whether it’s buying, selling, or holding their gold investments.
2. USD/IRR Exchange Rate
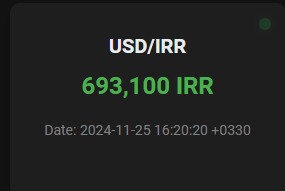
Currency exchange rates are pivotal for international trade, travel, and investment. The USD/IRR (US Dollar to Iranian Rial) exchange rate is particularly significant for businesses and individuals operating between these two economies.
Feature Highlights:
- Current Exchange Rate: View the latest USD to IRR conversion rate.
- Historical Trends: Track how the exchange rate has evolved over time.
- Date of Last Update: Ensure you’re viewing the most recent data.
Why It Matters:
Exchange rates can impact the cost of imports and exports, affect investment returns, and influence purchasing power. Real-time monitoring helps in making informed decisions related to currency conversion, budgeting, and financial planning.
3. Shanghai Metal Market Aluminum Price
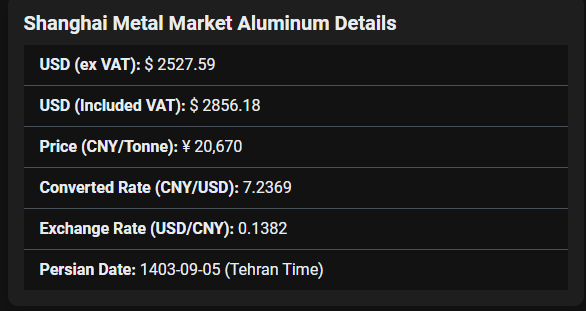
The Shanghai Metal Market (SMM) is a prominent platform for trading aluminum and other metals in China. Monitoring aluminum prices is essential for manufacturers, traders, and investors involved in the metal industry.
Feature Highlights:
- Current Price: Access the latest aluminum prices in USD and CNY per tonne.
- Detailed Metrics: View converted rates between CNY/USD and USD/CNY.
- Date of Last Update: Stay updated with the freshest data.
Why It Matters:
Aluminum prices influence manufacturing costs, investment decisions, and trade balances. Real-time data aids businesses in managing production costs, setting competitive prices, and strategizing market entries or exits.
4. LME Aluminum Price
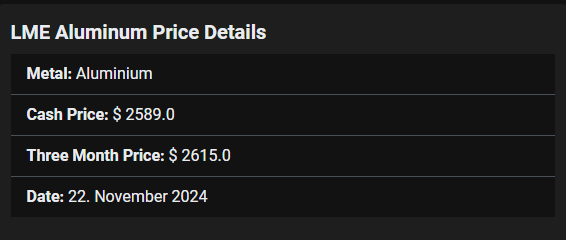
The London Metal Exchange (LME) is one of the world’s leading markets for industrial metals. The LME aluminum price is a benchmark for global aluminum trade.
Feature Highlights:
- Settlement Price: View the current settlement price of aluminum.
- Three-Month Price Forecast: Access projected prices to aid in long-term planning.
- Metal Type: Confirm the metal being tracked for accuracy.
- Date of Last Update: Ensure data reliability with timestamp information.
Why It Matters:
The LME aluminum price serves as a reference for contracts, investments, and pricing strategies worldwide. Accurate and timely data is essential for market participants to navigate the complexities of global metal trading.
5. Detailed Information Sections
Beyond the primary price indicators, the dashboard offers detailed sections that provide deeper insights into market dynamics.
Feature Highlights:
- Comprehensive Metrics: Access a range of data points, including VAT-inclusive prices, exchange rates, and Persian dates.
- Organized Layout: View information in structured lists for easy comprehension.
- Interactive Elements: Engage with data that can be expanded or collapsed based on user preference.
Why It Matters:
Detailed information empowers users to conduct thorough analyses, identify patterns, and make data-driven decisions. Whether it’s understanding the impact of VAT on prices or analyzing exchange rate fluctuations, these sections add layers of depth to the market insights provided.
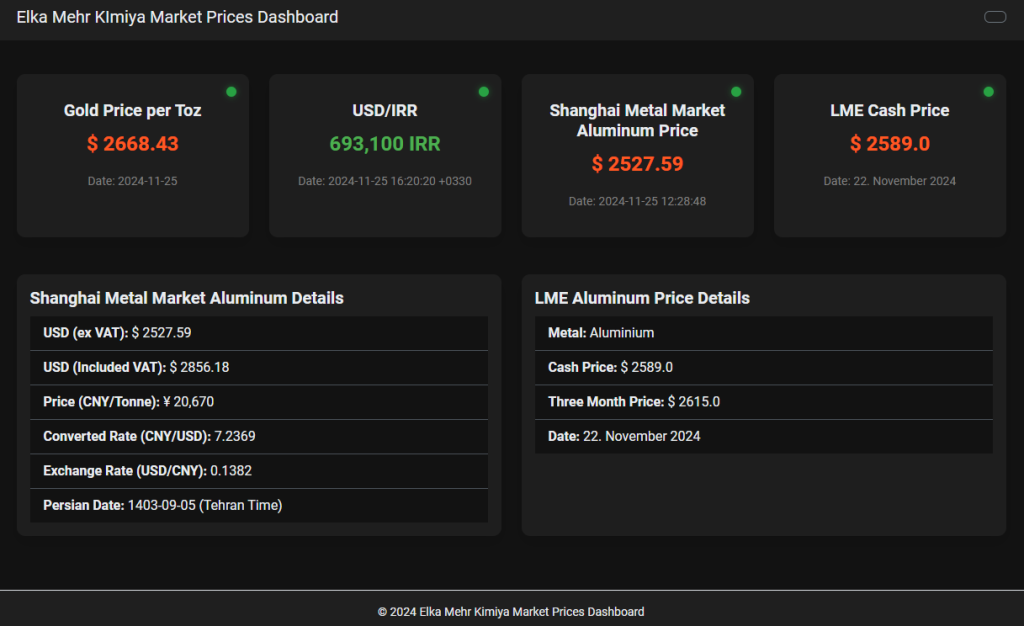
User Interface and Experience
A dashboard’s effectiveness hinges not just on the data it presents but also on how intuitively users can interact with it. The Market Prices Dashboard boasts a meticulously designed user interface that prioritizes both aesthetics and functionality.
Responsive Design
In an era where users access information from a multitude of devices—ranging from desktops to smartphones—ensuring a responsive design is paramount.
Design Features:
- Fluid Layouts: Adapt seamlessly to various screen sizes, ensuring optimal display on all devices.
- Adaptive Elements: Buttons, menus, and interactive components adjust their size and placement based on the device.
- Consistent Experience: Maintain uniform functionality and appearance across platforms.
User Benefits:
- Accessibility: Users can access critical data anytime, anywhere, without compromising on user experience.
- Convenience: Switch between devices without having to relearn navigation or adjust to different layouts.
Dark Mode Toggle
Visual comfort plays a significant role in user satisfaction, especially during prolonged usage. The dashboard incorporates a Dark Mode Toggle feature, allowing users to switch between light and dark themes effortlessly.
Feature Highlights:
- User Preference: Cater to individual aesthetic preferences and reduce eye strain in low-light environments.
- Seamless Transition: Instant switching between themes without page reloads.
- Consistent Design: Both themes maintain the same level of readability and aesthetic appeal.
User Benefits:
- Enhanced Readability: Choose the theme that best suits your viewing conditions.
- Personalization: Tailor the dashboard’s appearance to match your style or mood.
Enhanced Readability and Accessibility
The dashboard’s design emphasizes clarity, ensuring that data is presented in a manner that’s easy to read and interpret.
Design Features:
- Bold and Color-Coded Prices: Prices are displayed prominently with distinct colors, making them stand out.
- Subtle Shadows and Animations: Enhance visual hierarchy without causing distractions.
- Clear Typography: Utilize fonts and sizes that promote readability across all devices.
User Benefits:
- Quick Data Interpretation: Easily identify key metrics at a glance.
- Reduced Cognitive Load: Organized and clean design helps in focusing on essential information.
- Inclusivity: Accessible design ensures usability for a diverse range of users, including those with visual impairments.
Benefits of Using the Market Prices Dashboard
The Market Prices Dashboard is more than just a data display tool; it’s a comprehensive solution that offers numerous benefits to its users.
Empowered Decision Making
Access to real-time and historical data empowers users to make informed decisions.
Benefits:
- Strategic Investments: Identify profitable opportunities and mitigate risks effectively.
- Timely Actions: React promptly to market changes, ensuring optimal outcomes.
- Data-Driven Insights: Base your decisions on concrete data rather than intuition.
Time-Saving Automation
Manual tracking of market prices can be time-consuming and prone to errors. The dashboard automates this process, saving users valuable time.
Benefits:
- Efficiency: Eliminate the need for constant manual data checks.
- Accuracy: Reduce the likelihood of errors associated with manual data entry.
- Focus on Analysis: Spend more time analyzing data rather than gathering it.
Comprehensive Data at Your Fingertips
The dashboard consolidates multiple data points into a single platform, offering a holistic view of the market.
Benefits:
- All-in-One Solution: Access various market indicators without switching between different platforms.
- Enhanced Insights: Correlate data from different sources to gain deeper market understanding.
- Convenient Access: Retrieve all necessary information in one centralized location.
How to Get Started
Embarking on your journey with the Market Prices Dashboard is straightforward. Here’s a step-by-step guide to help you get started:
- Visit the Website: Navigate to www.elkamehr.com to access the dashboard.
- Create an Account: Sign up using your email address to personalize your experience.
- Customize Your Dashboard: Select the market indicators you wish to monitor closely.
- Set Up Notifications: Configure alerts for specific price thresholds or market changes.
- Start Monitoring: Begin tracking real-time data and utilize the insights for your financial decisions.
Additional Tips:
- Explore Features: Take time to familiarize yourself with all the dashboard’s features to maximize its potential.
- Stay Updated: Regularly check for updates or new features that enhance functionality.
- Provide Feedback: Share your experiences to help us improve the dashboard further.
Future Enhancements
At Elka Mehr Kimiya, we are committed to continuous improvement. Here’s a glimpse into what’s on the horizon for the Market Prices Dashboard:
1. Interactive Charts and Graphs
Visual representations of data enhance understanding and facilitate trend analysis. We plan to integrate interactive charts and graphs, allowing users to visualize price movements over time.
2. Predictive Analytics
Leveraging machine learning, future updates will include predictive analytics to forecast market trends, aiding users in proactive decision-making.
3. Mobile Application
To complement our web-based dashboard, a dedicated mobile application is in the pipeline, ensuring users can access data seamlessly on their smartphones and tablets.
4. Enhanced Customization
Future iterations will offer more customization options, enabling users to tailor the dashboard to their specific needs and preferences.
5. Integration with Other Financial Tools
Plans are underway to integrate the dashboard with other financial tools and platforms, offering a more unified financial management experience.
Conclusion
In the realm of finance and trading, information is power. The Market Prices Dashboard by Elka Mehr Kimiya stands as a testament to our dedication to empowering users with accurate, real-time market data. By consolidating essential market indicators into a user-friendly, responsive interface, we provide a tool that not only simplifies data access but also enhances decision-making.
Whether you’re an investor seeking the latest gold prices, a trader monitoring currency exchange rates, or a business managing production costs based on metal prices, our dashboard caters to your diverse needs. As we continue to innovate and expand our features, we remain committed to delivering unparalleled value to our users.
Frequently Asked Questions (FAQ)
1. What is the Market Prices Dashboard?
The Market Prices Dashboard is a web-based application developed by Elka Mehr Kimiya that provides real-time insights into key market indicators such as gold prices, USD/IRR exchange rates, aluminum prices from the Shanghai Metal Market, and LME aluminum prices.
2. Who can benefit from using the dashboard?
Investors, traders, market analysts, business owners, and anyone interested in monitoring financial markets can benefit from using the dashboard.
3. How often is the data updated?
The dashboard fetches real-time data, ensuring that users have access to the most current market information available.
4. Is the dashboard mobile-friendly?
Yes, the dashboard features a responsive design, allowing seamless access and optimal viewing on various devices, including smartphones and tablets.s.
5. How can I provide feedback or request new features?
We welcome user feedback and suggestions. You can reach out to us through the contact page on our website.
Optimize Your Financial Journey with the Market Prices Dashboard
In an age where information is ubiquitous yet accuracy and timeliness are rare, the Market Prices Dashboard emerges as a beacon of reliability and efficiency. By harnessing the power of real-time data and combining it with an intuitive user interface, Elka Mehr Kimiya has created a tool that not only meets but exceeds the expectations of modern financial stakeholders.
Embrace the Power of Real-Time Data
Imagine being able to monitor gold prices, track USD/IRR exchange rates, and analyze aluminum market trends—all from a single, centralized platform. The Market Prices Dashboard makes this possible, providing you with the tools you need to stay ahead in the competitive financial landscape.
A Tool Tailored to Your Needs
Whether you’re an individual investor or part of a large organization, the dashboard’s customization options ensure that you focus on the data points that matter most to you. With user-friendly features and a design that prioritizes ease of use, navigating the dashboard is a breeze, regardless of your technical expertise.
Stay Informed, Stay Ahead
In financial markets, timing is everything. The ability to access real-time data means you can make informed decisions quickly, capitalizing on opportunities as they arise and mitigating potential risks before they escalate.
Get Started Today
Don’t let outdated information hold you back. Visit dashboard today to explore the Market Prices Dashboard and take the first step towards smarter, data-driven financial decision-making.

No comment