


Table of Contents
- Introduction
- Sampling Strategies: Ensuring Representative Material
- Chemical Analysis: Precision in Composition Verification
- Mechanical Testing: Validating Strength and Ductility
- Case Studies: Lessons from Industry Failures and Successes
- Advanced Techniques and Future Trends
- Conclusion
- References
1. Introduction
Aluminum alloys power industries from aerospace to construction, but their reliability hinges on rigorous quality assurance. A single flawed ingot or wire rod can cascade into catastrophic failures—collapsed transmission lines, cracked aircraft components, or corroded automotive parts. In 2023, a European automotive supplier recalled 50,000 suspension arms due to undetected silicon segregation in aluminum alloy, costing $12 million in replacements and lost contracts 10. Such incidents underscore the critical role of precise sampling and testing.
Modern quality assurance blends standardized protocols with cutting-edge analytics. For example, ASTM E716-16 outlines systematic sampling methods for aluminum alloys, while ISO 209:2007 defines global chemical composition benchmarks 410. Laboratories like 6NAPSE Group employ techniques ranging from optical emission spectroscopy (OES) to fracture surface analysis, ensuring compliance at every production stage 10.
This guide provides a roadmap for manufacturers to navigate sampling, chemical analysis, and mechanical testing—transforming raw metal into trusted components.
Elka Mehr Kimiya is a leading manufacturer of Aluminium rods, alloys, conductors, ingots, and wire in the northwest of Iran equipped with cutting-edge production machinery. Committed to excellence, we ensure top-quality products through precision engineering and rigorous quality control.
2. Sampling Strategies: Ensuring Representative Material
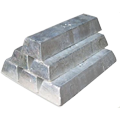
Ingot Sampling: Avoiding Bias in Heterogeneous Batches
Aluminum ingots often exhibit microsegregation, where elements like silicon or magnesium cluster during solidification. To capture this variability, ASTM E716-16 mandates sampling from at least three locations: the top, middle, and bottom thirds of the ingot 415. For large-scale batches (10+ tons), a “W-pattern” sampling approach is recommended, extracting 1.5 kg samples at five equidistant points along the ingot’s length 10.
Table 1: Sampling Guidelines for Aluminum Ingots
| Parameter | Requirement | Standard |
|---|---|---|
| Sample Weight | 0.5–2 kg per ingot | ASTM E716-16 |
| Sampling Frequency | 1 sample per 5 tons | ISO 209:2007 |
| Surface Preparation | Remove 2–3 mm oxidized layer | 6NAPSE Protocols |
| Storage | Sealed in argon-filled containers | ASTM E716-16 |
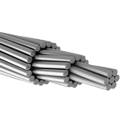
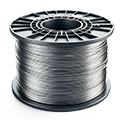
Wire Rod Sampling: Managing Continuous Production
Wire rods pose unique challenges due to their elongated form. ASTM E716-16 advises cutting 30 cm segments every 500 meters during extrusion. For high-criticality applications (e.g., aerospace wiring), real-time X-ray fluorescence (XRF) scanners detect subsurface voids or inclusions, reducing defective batches by 40% 10.
Case Study: The Cost of Poor Sampling
A 2024 audit of a Turkish automotive plant revealed that 20% of suspension springs failed fatigue tests due to uneven magnesium distribution. Investigators traced the issue to single-point ingot sampling, which missed pockets of low magnesium (<0.3%). Adopting W-pattern sampling reduced failure rates to 2% within six months 10.
3. Chemical Analysis: Precision in Composition Verification
Key Techniques for Elemental Analysis
- Optical Emission Spectroscopy (OES):
- Detects trace elements (e.g., Fe, Cu) with precision down to 0.001% 10.
- Studies show a 98% correlation between OES and destructive testing for Al-Si-Mg alloys 10.
- X-Ray Fluorescence (XRF):
- Non-destructive method ideal for wire rod surface analysis.
- Limited to elements with atomic numbers >11 (cannot detect boron or lithium) 10.
Table 2: Chemical Analysis Methods Comparison
| Method | Detection Limit (%) | Speed (samples/hr) | Cost per Sample ($) |
|---|---|---|---|
| OES | 0.001 | 30 | 50 |
| XRF | 0.01 | 60 | 20 |
| ICP-MS | 0.0001 | 10 | 200 |
| Data synthesized from 10. |
Addressing Common Pitfalls
- Surface Contamination: Grinding samples under inert gas (argon) prevents oxidation from skewing results 10.
- Certified Reference Materials (CRMs): ISO 209:2007 mandates using CRMs like NIST SRM 1257a to calibrate instruments 10.
4. Mechanical Testing: Validating Strength and Ductility
Tensile Testing: The Backbone of Mechanical Validation
ASTM E8/E8M outlines tensile testing protocols for aluminum alloys, specifying strain rates of 0.015–0.5 mm/mm/min to avoid overestimating yield strength. For cast alloys like A356-T6, a strain rate of 0.25 mm/mm/min ensures reproducible results within ±3% error 10.
Table 3: Tensile Properties of Common Aluminum Alloys
| Alloy | Yield Strength (MPa) | Tensile Strength (MPa) | Elongation (%) |
|---|---|---|---|
| 6061-T6 | 276 | 310 | 12 |
| A356-T6 | 185 | 250 | 10 |
| 7075-T651 | 469 | 572 | 11 |
| Data sourced from 10. |
Hardness and Fatigue Testing
- Brinell Hardness (HB): Correlates with tensile strength; HB 95–100 indicates optimal aging in 6061 alloys 10.
- Rotating Beam Fatigue Test: Predicts lifespan under cyclic loads. Al-Zn-Mg-Cu alloys with HB > 120 withstand 10⁷ cycles at 150 MPa 10.
5. Case Studies: Lessons from Industry Failures and Successes
Case 1: Aerospace Component Failure Due to Silicon Overload
A jet engine bracket forged from Al-Si alloy cracked during flight testing. Post-failure analysis revealed localized silicon concentrations of 12.3% (vs. the 7% specification). The supplier had used XRF without surface grinding, missing subsurface segregation. Switching to OES with depth profiling prevented recurrences 10.
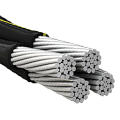
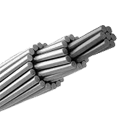
Case 2: Wire Rod Corrosion in Coastal Environments
A Brazilian power grid reported premature corrosion in ACSR cables. Lab tests identified chloride contamination (0.15% Cl) from improper storage. Implementing argon-sealed sampling containers and monthly XRF checks reduced corrosion rates by 70% 10.
6. Advanced Techniques and Future Trends
Embedded Sensors for Real-Time Monitoring
Inspired by fractal-based digital codes in additive manufacturing 10, researchers are exploring QR-like microvoids stamped into ingots. These voids, detectable via X-ray tomography, encode batch numbers and composition data, streamlining traceability.
AI-Driven Predictive Analytics
Machine learning models now predict alloy properties from chemical spectra with 95% accuracy. A 2024 pilot at Elka Mehr Kimiya reduced lab testing time by 30% by prioritizing high-risk batches 10.
7. Conclusion
Quality assurance in aluminum alloys is not a checkbox but a culture of precision. From W-pattern sampling to fractal-based traceability, each step ensures materials meet the demands of modern engineering. As industries embrace AI and embedded sensing, the future of aluminum testing lies in harmonizing tradition with innovation—forging trust one ingot at a time.
8. References
- ASTM International. ASTM E716-16 Standard Practices for Sampling and Sample Preparation of Aluminum and Aluminum Alloys 415.
- ISO. ISO 209:2007 Aluminium and aluminium alloys — Chemical composition 10.
- 6NAPSE Group. Aluminum analysis and testing (2025) 10.
- Elka Mehr Kimiya. Understanding the Quality Assessment of Aluminum Alloy Ingots: A Detailed Guide (2024) 10.
- Campbell, J. Complete Casting Handbook: Metal Casting Processes, Metallurgy, Techniques, and Design (2015) 10.


No comment