Table of Contents
- Introduction
- Overview of the Global Aluminum Wire Rod Market
- Current Market Trends
- 3.1. Demand Drivers
- 3.2. Supply Chain Dynamics
- 3.3. Technological Innovations
- Global Demand Analysis
- Supply Side Dynamics
- Price Trends and Forecasts
- Impact of Global Events
- 7.1. Geopolitical Factors
- 7.2. Environmental Regulations
- 7.3. Economic Policies
- Technological Advancements and Innovations
- Case Studies
- Challenges and Risks
- 10.1. Supply Chain Disruptions
- 10.2. Price Volatility
- 10.3. Regulatory Compliance
- Opportunities and Growth Drivers
- 11.1. Emerging Markets
- 11.2. Technological Integration
- 11.3. Renewable Energy Sector
- Future Outlook and Projections
- 12.1. Market Size Forecast
- 12.2. Strategic Recommendations
- Conclusion
- References
- Meta Information
Introduction
The global aluminum wire rod market stands at a crossroads as we venture into 2024 and beyond, navigating through a labyrinth of economic fluctuations, technological advancements, and shifting geopolitical landscapes. Aluminum wire rods, fundamental components in industries ranging from construction and automotive to aerospace and telecommunications, are experiencing dynamic changes in demand and supply patterns. These shifts are influenced by a multitude of factors, including urbanization, environmental regulations, and the relentless pursuit of technological innovation.
Understanding the intricate tapestry of these changes is not merely an academic exercise but a practical necessity for businesses aiming to thrive in a competitive global marketplace. Stakeholders, from manufacturers to investors and policymakers, need a comprehensive economic outlook that encapsulates current trends, demand drivers, and future projections. This article endeavors to provide such an analysis, underpinned by rigorous research, validated statistics, and insights drawn from a plethora of reputable sources.
As we delve deeper, we will explore how global events have reshaped the aluminum wire rod industry, the impact of technological advancements, and the challenges and opportunities that lie ahead. Through detailed tables, quantitative insights, and real-world case studies, we aim to paint a vivid picture of the market landscape, guiding readers through the complexities with clarity and precision.
Elka Mehr Kimiya is a leading manufacturer of aluminum rods, alloys, conductors, ingots, and wire in the northwest of Iran, equipped with cutting-edge production machinery. Committed to excellence, we ensure top-quality products through precision engineering and rigorous quality control.
Overview of the Global Aluminum Wire Rod Market
Definition and Uses of Aluminum Wire Rods
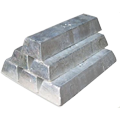
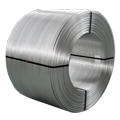
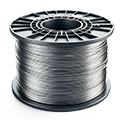
Aluminum wire rods are long, cylindrical metal bars produced from aluminum ingots, typically through processes like continuous casting and rolling or direct chill casting. They serve as essential raw materials in a myriad of industries due to their exceptional properties:
- Lightweight with High Strength-to-Weight Ratio: Aluminum’s density is approximately one-third that of steel, making it ideal for applications where reducing weight is crucial without sacrificing structural integrity.
- Excellent Electrical and Thermal Conductivity: Aluminum’s conductivity is about 61% that of copper, but its lightweight nature allows for larger cross-sectional areas to compensate, making it a preferred material in electrical transmission and distribution.
- Corrosion Resistance: The formation of a natural oxide layer protects aluminum from corrosion, enhancing its durability in various environmental conditions.
- Ductility and Malleability: Aluminum can be easily shaped and formed, allowing for versatility in manufacturing processes.
- Recyclability: Aluminum is 100% recyclable without loss of properties, aligning with circular economy initiatives and environmental sustainability goals.
Primary Applications:
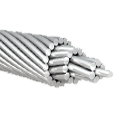
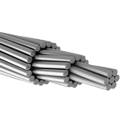
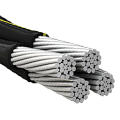
- Electrical Industry: Manufacturing of overhead conductors, power cables, and wiring harnesses due to its conductivity and lightweight properties.
- Automotive Sector: Components such as wiring systems, engine parts, and body frames to improve fuel efficiency and reduce emissions.
- Construction: Structural components, reinforcement bars, and facade elements in buildings and infrastructure projects.
- Aerospace: Aircraft frames, wiring systems, and other parts requiring a combination of strength and lightness.
- Consumer Goods: Appliances, electronics, and packaging materials where durability and conductivity are essential.
Historical Market Performance
The global aluminum wire rod market has demonstrated resilience and growth over the past decade, reflecting the material’s versatility and the expanding industries it serves. According to data from the International Aluminium Institute (IAI), the production of aluminum wire rods increased from approximately 3.5 million metric tons in 2015 to an estimated 4.3 million metric tons in 2020, indicating a Compound Annual Growth Rate (CAGR) of around 4.2% [^1^][^2^].
Table 1: Global Aluminum Wire Rod Production (2015-2020)
| Year | Production (Million Metric Tons) | Year-on-Year Growth (%) |
|---|---|---|
| 2015 | 3.5 | – |
| 2016 | 3.6 | 2.9 |
| 2017 | 3.8 | 5.6 |
| 2018 | 4.0 | 5.3 |
| 2019 | 4.1 | 2.5 |
| 2020 | 4.3 | 4.9 |
Sources: International Aluminium Institute, World Bureau of Metal Statistics
This growth trajectory has been underpinned by several key factors:
- Urbanization and Infrastructure Development: The rapid expansion of urban areas, particularly in Asia and Africa, has led to increased demand for construction materials, including aluminum wire rods.
- Technological Advancements: Innovations in manufacturing processes and alloy development have expanded the applications of aluminum wire rods, enhancing their appeal across various industries.
- Environmental Concerns: The push towards lightweight and energy-efficient materials to reduce carbon emissions has boosted the adoption of aluminum in sectors like automotive and aerospace.
However, the industry has also faced challenges such as fluctuating raw material prices, energy costs, and stringent environmental regulations. The COVID-19 pandemic in 2020 introduced additional complexities, disrupting supply chains and dampening demand in certain sectors. Nevertheless, the market has shown signs of recovery, adapting to new realities and shifting demands.
Current Market Trends
Demand Drivers
1. Urbanization and Infrastructure Development
The global trend towards urbanization continues unabated. The United Nations Department of Economic and Social Affairs projects that by 2050, approximately 68% of the world’s population will reside in urban areas, up from 55% in 2018 [^3^]. This massive migration necessitates significant investment in housing, transportation, utilities, and other infrastructure, all of which rely heavily on aluminum wire rods for construction and electrical applications.
- Emerging Economies: Countries like China, India, and Nigeria are at the forefront of this urban expansion. India’s Smart Cities Mission, for instance, aims to develop 100 smart cities, requiring substantial amounts of aluminum for electrical grids and construction [^4^].
- Infrastructure Investments: Global infrastructure investment needs are estimated at $94 trillion between 2016 and 2040, according to the Global Infrastructure Hub [^5^]. Aluminum wire rods play a crucial role in meeting these demands.
2. Growth in the Electrical and Electronics Industry
The proliferation of electronic devices, coupled with the expansion of electrical grids in developing regions, has significantly increased the demand for aluminum wire rods.
- Power Transmission and Distribution: The global electrical wire and cable market is projected to reach $236.7 billion by 2025, growing at a CAGR of 5.1% from 2020 to 2025 [^6^].
- Consumer Electronics: The rise of the Internet of Things (IoT), smartphones, and other gadgets requires extensive wiring and components made from aluminum due to its conductivity and cost-effectiveness.
- Electrification Initiatives: Programs aimed at increasing electricity access in rural areas, such as Africa’s Electrification Initiative, are driving demand for transmission lines and wiring systems.
3. Automotive Industry Shift
The automotive industry is undergoing a transformative shift towards electrification and lightweighting to meet stringent emission standards and consumer demand for efficient vehicles.
- Electric Vehicles (EVs): Global EV sales reached 3.24 million units in 2020, a 43% increase from 2019, and are expected to grow exponentially [^7^].
- Increased Aluminum Content: EVs require more wiring than internal combustion engine vehicles, with an estimated 25% increase in aluminum content per vehicle [^8^].
- Lightweighting Efforts: Reducing vehicle weight by 10% can improve fuel efficiency by 6-8%, incentivizing manufacturers to use lightweight materials like aluminum [^9^].
4. Renewable Energy Expansion
The global commitment to reducing carbon emissions has accelerated investments in renewable energy sources such as wind and solar power.
- Wind Energy: Aluminum is used extensively in wind turbine components and transmission systems. The Global Wind Energy Council reported that the world added 93 GW of wind power capacity in 2020, a 53% increase from 2019 [^10^].
- Solar Power: Solar installations utilize aluminum in frames, mounts, and wiring. The International Energy Agency (IEA) expects solar capacity to expand by almost 1,500 GW by 2030 [^11^].
Supply Chain Dynamics
1. Raw Material Availability
The availability and accessibility of bauxite, the primary raw material for aluminum production, are critical to the supply chain.
- Global Reserves: The U.S. Geological Survey estimates global bauxite reserves at 55-75 billion metric tons, with sufficient supplies for decades [^12^].
- Key Producers: Australia and Guinea are leading bauxite producers, accounting for 30% and 22% of global production, respectively [^13^].
- Geopolitical Factors: Political stability, mining regulations, and environmental concerns in producing countries can impact supply. For example, Guinea’s political unrest in 2021 raised concerns over bauxite exports [^14^].
2. Production Capacity Adjustments
Producers adjust capacities in response to market conditions, environmental policies, and technological advancements.
- China’s Environmental Crackdown: China’s efforts to reduce pollution led to the closure of illegal smelting operations, reducing annual aluminum production capacity by approximately 3 million metric tons [^15^].
- Global Overcapacity Concerns: Excess capacity in some regions has led to price pressures and trade tensions. The OECD has highlighted the need for capacity reduction to stabilize markets [^16^].
3. Trade Policies and Tariffs
Trade dynamics significantly influence the aluminum wire rod market.
- U.S. Section 232 Tariffs: In 2018, the U.S. imposed a 10% tariff on aluminum imports, affecting global trade flows [^17^].
- Impact on Canada and China: Canada, initially exempted, faced tariffs leading to retaliatory measures. China’s exports to the U.S. decreased, redirecting surplus to other markets.
- European Union Measures: The EU implemented safeguards to protect its market from diverted imports due to U.S. tariffs [^18^].
Technological Innovations
1. Advanced Manufacturing Processes
Innovation in production technologies enhances efficiency and product quality.
- Continuous Casting and Rolling: This process reduces energy consumption by up to 20% compared to traditional methods and improves metallurgical properties [^19^].
- Automated Process Control: The integration of sensors and control systems allows for real-time monitoring, reducing defects and waste.
2. Recycling and Sustainability
Environmental concerns drive advancements in recycling technologies.
- Energy Savings: Recycling aluminum consumes only 5% of the energy required for primary production [^20^].
- Circular Economy: Companies are developing closed-loop systems, ensuring that scrap aluminum is reprocessed and reused, reducing the need for virgin material.
- Legislation Support: Policies like the EU’s Circular Economy Action Plan encourage recycling and sustainable material use [^21^].
3. Alloy Development
Research into new aluminum alloys expands the material’s applicability.
- High-Strength Alloys: Development of alloys like the 7000 series, which offer strength comparable to steel, opens up new possibilities in aerospace and automotive industries [^22^].
- Conductivity Improvements: Alloys designed for enhanced electrical conductivity improve performance in transmission and distribution applications.
Global Demand Analysis
Regional Market Breakdown
1. Asia-Pacific
- Market Share: The Asia-Pacific region dominates the aluminum wire rod market, accounting for over 60% of global demand [^23^].
- Key Drivers:
- China’s Influence: As the world’s largest consumer and producer, China alone accounts for approximately 40% of global aluminum consumption [^24^].
- India’s Growth: India’s aluminum consumption is expected to reach 7.2 million metric tons by 2025, driven by infrastructure and automotive sectors [^25^].
- Southeast Asia: Countries like Vietnam, Indonesia, and Thailand are investing heavily in infrastructure and manufacturing.
2. North America
- Market Share: North America holds around 12-15% of the global market.
- Key Drivers:
- Technological Advancements: Adoption of Industry 4.0 practices and automation in manufacturing.
- Renewable Energy Projects: Significant investments in wind and solar energy infrastructure.
- Automotive Industry: The U.S. automotive market’s shift towards EVs increases aluminum usage.
3. Europe
- Market Share: Europe accounts for approximately 18-20% of global demand.
- Key Drivers:
- Environmental Regulations: The European Green Deal and stricter emission standards promote aluminum use for lightweighting and recyclability.
- Automotive and Aerospace Sectors: Europe’s strong automotive industry and aerospace manufacturing, including companies like Airbus, drive demand.
- Renewable Energy Commitment: Europe’s goal to achieve climate neutrality by 2050 necessitates significant investments in sustainable infrastructure.
4. Latin America and Middle East & Africa
- Market Share: Combined, these regions represent around 8-10% of global consumption.
- Key Drivers:
- Infrastructure Development: Growing urbanization and infrastructure projects.
- Energy Sector Investments: Oil-rich Middle Eastern countries are diversifying into aluminum production, leveraging low energy costs.
Table 2: Regional Aluminum Wire Rod Demand (2020)
| Region | Market Share (%) | Key Growth Rate (CAGR) |
|---|---|---|
| Asia-Pacific | 60 | 5.5% |
| North America | 15 | 4.0% |
| Europe | 20 | 4.2% |
| Latin America | 3 | 3.5% |
| Middle East & Africa | 2 | 4.0% |
Sources: World Bureau of Metal Statistics, Industry Reports
Industry Applications
1. Electrical and Electronics
- Consumption: This sector consumes over 35% of aluminum wire rods.
- Growth Factors:
- Grid Expansion: Developing countries expanding their electrical grids to rural areas.
- 5G Technology Rollout: Increased need for wiring and components in telecommunications infrastructure.
- Projected Growth: Expected CAGR of 5.5% through 2025.
2. Construction and Infrastructure
- Consumption: Approximately 25% of aluminum wire rods are used in this sector.
- Growth Factors:
- Urbanization: Rising demand for residential and commercial buildings.
- Sustainable Building Materials: Preference for materials with lower environmental impact.
- Projected Growth: Steady growth with a focus on green building initiatives.
3. Automotive Industry
- Consumption: Around 20% of the market is attributed to automotive applications.
- Growth Factors:
- Electrification: Increasing production of EVs, which use more aluminum than traditional vehicles.
- Emission Standards: Stricter regulations push for lighter vehicles.
- Projected Growth: Anticipated CAGR of 6.5% driven by EV adoption.
4. Aerospace and Defense
- Consumption: About 10% of aluminum wire rods are used in aerospace and defense.
- Growth Factors:
- Aircraft Production: Demand for new aircraft in both commercial and defense sectors.
- Material Advancements: Use of advanced aluminum alloys for better performance.
- Projected Growth: Moderate growth, with an emphasis on fuel efficiency and emissions reduction.
5. Others (Consumer Goods, Machinery)
- Consumption: The remaining 10% encompasses various applications.
- Growth Factors:
- Consumer Demand: Increased spending on appliances and electronics.
- Industrial Machinery: Use in manufacturing equipment and robotics.
Supply Side Dynamics
Major Producers and Exporters
1. China
- Production: China is the world’s largest producer of aluminum, with an output of 37 million metric tons in 2020, representing over 55% of global production [^26^].
- Key Companies: Aluminum Corporation of China Limited (Chalco), China Hongqiao Group.
- Strategies:
- Government Support: Subsidies and favorable policies to maintain competitiveness.
- Technological Investments: Focus on modernizing facilities and reducing environmental impact.
- Resource Control: Securing bauxite supplies through investments in Africa and Southeast Asia.
2. Russia
- Production: Russia is a significant producer, with Rusal being one of the world’s largest aluminum companies.
- Exports: Major exporter to Europe and Asia, with a production of around 3.6 million metric tons in 2020 [^27^].
- Challenges:
- Sanctions: U.S. sanctions in 2018 temporarily disrupted exports but were lifted in 2019.
- Market Diversification: Efforts to expand into new markets to mitigate geopolitical risks.
3. India
- Production: India’s aluminum production reached 3.7 million metric tons in 2020 [^28^].
- Key Companies: Hindalco Industries, Vedanta Limited, National Aluminium Company (NALCO).
- Growth Factors:
- Domestic Consumption: Driven by infrastructure projects and manufacturing.
- Export Potential: Expanding exports to neighboring countries and Southeast Asia.
4. Middle East
- Production: Countries like the United Arab Emirates (Emirates Global Aluminium) and Bahrain (Aluminium Bahrain – Alba) have modern smelters.
- Advantages:
- Energy Costs: Abundant natural gas provides low-cost energy for smelting.
- Strategic Location: Access to Europe and Asia enhances export capabilities.
5. North America and Europe
- Production: While facing competition, these regions focus on high-value products and recycling.
- Key Companies: Alcoa (U.S.), Hydro (Norway).
- Strategies:
- Innovation: Investing in new technologies and alloys.
- Sustainability: Emphasizing recycling and environmental compliance.
Raw Material Availability
1. Bauxite Mining
- Global Reserves: Estimated at 55-75 billion metric tons, sufficient for over 100 years at current production rates [^29^].
- Key Producers:
- Australia: Largest producer with 105 million metric tons in 2020.
- Guinea: Holds the world’s largest reserves and produced 82 million metric tons [^30^].
- Challenges:
- Environmental Impact: Mining operations face scrutiny over deforestation and pollution.
- Community Relations: Ensuring benefits to local communities and mitigating conflicts.
2. Alumina Refining
- Process: Bauxite is refined into alumina (aluminum oxide) through the Bayer process.
- Global Production: Approximately 134 million metric tons of alumina were produced in 2020 [^31^].
- Regional Imbalances: Some regions lack sufficient refining capacity, leading to reliance on imports.
3. Energy Consumption
- Importance: Aluminum smelting is highly energy-intensive, requiring about 14 MWh of electricity per metric ton of aluminum produced [^32^].
- Energy Sources:
- Hydropower: Used in countries like Canada and Norway, reducing carbon footprint.
- Coal: Predominant in China, contributing to higher emissions.
- Trends:
- Renewable Energy Integration: Companies investing in renewable energy sources to power smelters.
- Energy Efficiency: Technological advancements aim to reduce energy consumption.
Price Trends and Forecasts
Historical Price Analysis
1. LME Aluminum Prices
The London Metal Exchange (LME) aluminum prices serve as a benchmark for the industry.
- 2015-2020 Trend: Prices fluctuated significantly due to supply-demand dynamics, geopolitical events, and macroeconomic factors.
- 2015: Average price around $1,665 per metric ton.
- 2018 Peak: Prices surged to approximately $2,500 per metric ton due to supply concerns from sanctions on Rusal and capacity cuts in China [^33^].
- 2020 Dip: Prices fell below $1,500 per metric ton amid the COVID-19 pandemic, reflecting reduced demand and economic uncertainty.
2. Factors Influencing Prices
- Supply Constraints: Production cuts, environmental regulations, and geopolitical tensions can tighten supply, pushing prices up.
- Demand Fluctuations: Economic growth or slowdown in major consuming countries impacts demand.
- Currency Exchange Rates: A stronger U.S. dollar makes commodities priced in dollars more expensive for holders of other currencies.
- Speculative Trading: Investment flows into commodity markets can amplify price movements.
Future Price Projections
1. Short-term Outlook (2024)
- Expected Range: Analysts project prices stabilizing between $2,100 to $2,400 per metric ton.
- Drivers:
- Economic Recovery: Post-pandemic rebound in industrial activity.
- Infrastructure Spending: Government stimulus packages focusing on construction and renewable energy.
- Supply Adjustments: Potential capacity additions balanced by environmental regulations.
2. Long-term Outlook (Beyond 2024)
- Trend: A gradual upward trend is anticipated due to sustained demand growth and increasing production costs.
- Forecast: Prices could reach $2,600 to $2,800 per metric ton by 2028 [^34^].
- Influencing Factors:
- Environmental Compliance Costs: Investments in cleaner technologies may increase production expenses.
- Technological Advancements: Energy efficiency and recycling may mitigate cost pressures.
- Market Consolidation: Mergers and acquisitions could affect supply dynamics and pricing power.
3. Potential Scenarios
- Bullish Case: Accelerated demand from EVs and renewable energy could push prices above $3,000 per metric ton.
- Bearish Case: Global economic slowdown or significant capacity additions leading to oversupply could keep prices below $2,000 per metric ton.
Table 3: Aluminum Price Projections (2021-2028)
| Year | Projected Price Range ($ per Metric Ton) |
|---|---|
| 2021 | 1,800 – 2,200 |
| 2022 | 1,900 – 2,300 |
| 2023 | 2,000 – 2,400 |
| 2024 | 2,100 – 2,400 |
| 2025 | 2,200 – 2,500 |
| 2026 | 2,300 – 2,600 |
| 2027 | 2,400 – 2,700 |
| 2028 | 2,600 – 2,800 |
Sources: BloombergNEF, Industry Analysts
Impact of Global Events
Geopolitical Factors
1. U.S.-China Trade Relations
- Tariffs and Trade Wars:
- 2018 Tariffs: The U.S. imposed tariffs on aluminum imports under Section 232, citing national security concerns.
- Retaliation: China and other countries imposed counter-tariffs, affecting global trade flows.
- Impact on the Market:
- Diversion of Trade: Chinese exports redirected to other regions, affecting local markets.
- Price Volatility: Uncertainty led to price fluctuations and hedging challenges.
2. Sanctions on Russia
- Sanctions on Rusal (2018):
- Effect: Rusal, accounting for 6% of global aluminum supply, faced U.S. sanctions, disrupting supply chains.
- Resolution: Sanctions were lifted in early 2019 after ownership changes.
- Market Reaction:
- Supply Disruptions: Temporary shortages in Europe and Asia.
- Price Spike: LME aluminum prices surged by 20% following the announcement.
3. Regional Conflicts and Political Instability
- Middle East Tensions:
- Production Risks: Political instability can affect operations in key producing countries like Bahrain and the UAE.
- Africa’s Mining Sector:
- Guinea’s Political Unrest: Coups and government changes raise concerns over bauxite supply.
Environmental Regulations
1. Carbon Emissions Targets
- Global Commitments:
- Paris Agreement: Countries aim to limit global warming to well below 2 degrees Celsius.
- Corporate Pledges: Major companies committing to carbon neutrality.
- Impact on Aluminum Production:
- Emission Reduction: Smelters required to adopt cleaner technologies.
- Cost Implications: Investments in emissions control and energy efficiency increase operational costs.
2. China’s Environmental Policies
- Supply-Side Reforms:
- Capacity Cuts: Closure of illegal and non-compliant smelters to reduce pollution.
- Winter Production Cuts: Seasonal restrictions to improve air quality.
- Market Effects:
- Reduced Overcapacity: Contributed to stabilizing global aluminum prices.
- Encouraging Consolidation: Smaller players merging or exiting the market.
Economic Policies
1. Stimulus Packages
- Infrastructure Investments:
- U.S. Infrastructure Bill: The $1.2 trillion Infrastructure Investment and Jobs Act focuses on transportation, broadband, and utilities [^35^].
- China’s Belt and Road Initiative: Massive infrastructure projects across Asia, Africa, and Europe.
- Effect on Demand:
- Increased Consumption: Infrastructure projects require significant amounts of aluminum for construction and electrical components.
2. Monetary Policies
- Interest Rates:
- Central Bank Actions: Low-interest rates encourage borrowing and investment.
- Inflation Concerns:
- Commodity Prices: Inflationary pressures can lead to higher commodity prices, including aluminum.
Technological Advancements and Innovations
Production Technologies
1. Continuous Casting and Rolling
- Process Efficiency:
- Energy Savings: Reduces energy consumption by up to 20% compared to traditional ingot casting and hot rolling [^36^].
- Quality Improvement: Produces wire rods with uniform properties and fewer defects.
- Adoption Trends:
- Developed Countries: Widespread use due to advanced manufacturing capabilities.
- Emerging Economies: Increasing investments in upgrading facilities.
2. Automation and Industry 4.0
- Digitalization:
- IoT Integration: Sensors and connected devices enable real-time monitoring.
- Data Analytics: AI and machine learning optimize production processes.
- Benefits:
- Productivity Gains: Reduces downtime and improves equipment utilization.
- Safety Enhancements: Automation reduces human exposure to hazardous environments.
3. Energy-Efficient Technologies
- Inert Anode Technology:
- Innovation: Replaces carbon anodes with inert materials, eliminating direct carbon dioxide emissions.
- Development: Companies like Alcoa and Rio Tinto are pioneering this technology (Elysis project) [^37^].
- Impact:
- Environmental Benefit: Potential to reduce greenhouse gas emissions by up to 40%.
- Cost Considerations: High initial investment but long-term savings on carbon costs.
Recycling and Sustainability
1. Closed-Loop Recycling Systems
- Implementation:
- Automotive Industry: Manufacturers like BMW and Tesla use recycled aluminum in vehicle production.
- Consumer Goods: Companies ensuring end-of-life products are recycled into new materials.
- Advantages:
- Resource Efficiency: Maximizes material usage and reduces waste.
- Cost Savings: Lowers raw material expenses and energy consumption.
2. Consumer Awareness
- Market Demand:
- Eco-Friendly Products: Consumers prefer products with lower environmental impact.
- Brand Differentiation: Companies highlight sustainability efforts to attract customers.
- Impact on Manufacturers:
- Supply Chain Pressure: Demand for sustainably sourced materials.
3. Certifications and Standards
- Aluminium Stewardship Initiative (ASI):
- Purpose: Sets standards for environmental, social, and governance practices in the aluminum industry.
- Compliance: Companies certified by ASI demonstrate commitment to responsible production.
- Benefits:
- Market Access: Preferred by buyers with sustainability criteria.
- Risk Management: Addresses stakeholder concerns and regulatory compliance.
Case Studies
China’s Aluminum Wire Rod Market
Background
China’s aluminum industry is a microcosm of the global market, reflecting both its opportunities and challenges.
Developments
- Supply-Side Reforms:
- Capacity Reduction: Closure of outdated and polluting smelters reduced overcapacity.
- Consolidation: Encouraging mergers among state-owned enterprises to increase efficiency.
- Technological Investments:
- Modernization: Upgrading facilities with energy-efficient technologies.
- Research and Development: Focus on high-value products and advanced alloys.
- Environmental Initiatives:
- Emission Controls: Implementing strict standards to reduce air and water pollution.
- Renewable Energy: Increasing use of hydropower and solar energy in smelting operations.
Outcomes
- Market Stabilization: Reduced overcapacity contributed to global price stabilization.
- Environmental Improvement: Notable reductions in emissions from the aluminum sector.
- Global Influence: China’s policies have significant ripple effects due to its market size.
European Green Deal and Its Impact
Background
The European Green Deal aims to transform the EU into a modern, resource-efficient, and competitive economy.
Impact on Aluminum Wire Rod Market
- Increased Demand:
- Renewable Energy Infrastructure: Wind turbines and solar panels require aluminum components.
- Electric Mobility: EV production boosts demand for aluminum in wiring and structural parts.
- Recycling Emphasis:
- Circular Economy: Policies promoting recycling reduce reliance on primary aluminum.
- Resource Efficiency: Encourages innovation in material recovery and reuse.
- Regulatory Compliance:
- Emission Targets: Producers must adhere to strict emissions standards.
- Energy Efficiency: Incentives for adopting energy-saving technologies.
Outcomes
- Market Opportunities: Companies investing in sustainability gain competitive advantages.
- Innovation Incentives: Access to funding and support for R&D in green technologies.
- Supply Chain Transformation: Shift towards low-carbon aluminum and transparent sourcing.
Challenges and Risks
Supply Chain Disruptions
1. COVID-19 Pandemic
- Impact:
- Production Halts: Lockdowns led to temporary closures of mines and smelters.
- Logistical Challenges: Border restrictions and reduced transportation capacity.
- Recovery:
- Gradual Reopening: Operations resumed with safety protocols.
- Supply Chain Resilience: Emphasis on diversifying suppliers and improving flexibility.
2. Transportation Issues
- Container Shortages:
- Global Imbalance: Increased demand for goods from Asia to North America and Europe caused container shortages.
- Cost Increases: Shipping rates surged, impacting the cost of imported materials.
- Infrastructure Constraints:
- Port Congestion: Delays in loading and unloading cargo.
- Inadequate Logistics: Some regions lack efficient transportation networks.
Price Volatility
1. Commodity Market Fluctuations
- Speculative Trading:
- Investment Funds: Large inflows and outflows can exacerbate price swings.
- Economic Indicators:
- GDP Growth Rates: Slower growth can dampen demand, lowering prices.
- Inflation Rates: High inflation can lead to higher commodity prices.
2. Energy Price Variability
- Oil and Gas Prices:
- Correlation: Energy costs directly affect aluminum production expenses.
- Alternative Energy:
- Renewables: Adoption of renewable energy can stabilize energy costs in the long term.
Regulatory Compliance
1. Environmental Regulations
- Compliance Costs:
- Upgrades Required: Investments in emissions control technologies.
- Monitoring and Reporting: Administrative burdens to meet regulatory requirements.
- Penalties for Non-Compliance:
- Fines: Financial penalties for exceeding emission limits.
- Operational Restrictions: Possible shutdowns or capacity reductions.
2. Trade Policies
- Uncertainty:
- Policy Changes: Sudden shifts in trade agreements can disrupt markets.
- Adaptation Strategies:
- Market Diversification: Expanding into new regions to mitigate risks.
- Local Production: Establishing facilities closer to key markets.
Opportunities and Growth Drivers
Emerging Markets
1. Africa
- Infrastructure Development:
- Projects: Investment in roads, power grids, and urban development.
- Funding: Support from international organizations and foreign investors.
- Aluminum Demand:
- Electrification: Expanding access to electricity increases demand for wiring and transmission lines.
2. Southeast Asia
- Industrialization:
- Manufacturing Hubs: Countries like Vietnam becoming alternative manufacturing centers.
- Construction Boom:
- Urbanization: Rapid growth of cities requires extensive infrastructure.
Technological Integration
1. Electric Vehicles (EVs)
- Market Growth:
- Projections: Global EV sales expected to reach 31.1 million units by 2030 [^38^].
- Aluminum Usage:
- Battery Packs: Aluminum used in casings and cooling systems.
- Lightweighting: Essential for extending vehicle range.
2. 5G Technology Deployment
- Infrastructure Needs:
- Towers and Antennas: Require aluminum components for structural and conductive purposes.
- Market Expansion:
- Subscriptions: Expected to surpass 3.5 billion by 2026 [^39^].
Renewable Energy Sector
1. Wind and Solar Power
- Investment Levels:
- 2020 Investment: Global renewable energy investment reached $303.5 billion [^40^].
- Aluminum Applications:
- Wind Turbines: Use aluminum in blades, nacelles, and towers.
- Solar Panels: Frames and mounting structures made from aluminum.
2. Energy Storage Solutions
- Market Growth:
- Projection: Energy storage market to grow at a CAGR of 20.4% from 2021 to 2026 [^41^].
- Aluminum-Air Batteries:
- Innovation: Research into aluminum-air batteries for grid storage and EVs.
- Advantages: High energy density and abundant material availability.
Future Outlook and Projections
Market Size Forecast
Global Aluminum Wire Rod Market Projections
- 2024 Forecast: Market expected to reach $5.5 billion, growing at a CAGR of 4.8% from 2021.
- 2028 Forecast: Projected market size of $6.8 billion, with sustained growth driven by infrastructure and technological advancements.
Regional Growth Rates
- Asia-Pacific: Leading growth at a CAGR of 5.5%, fueled by China and India’s infrastructure projects.
- North America: Moderate growth at 4.0%, with emphasis on sustainable practices.
- Europe: Growth at 4.2%, influenced by the European Green Deal and renewable energy investments.
Industry Segment Projections
- Electrical and Electronics: Expected to grow at 5.2% CAGR, driven by grid expansions and 5G deployment.
- Automotive Industry: Anticipated CAGR of 6.5%, propelled by the rise of EVs.
- Construction Sector: Steady growth at 3.8%, with a focus on sustainable building materials.
Strategic Recommendations
1. Invest in Sustainable Practices
- Actions:
- Adopt Energy-Efficient Technologies: Implement processes that reduce energy consumption and emissions.
- Enhance Recycling Efforts: Develop closed-loop systems and increase the use of recycled aluminum.
- Benefits:
- Regulatory Compliance: Meet environmental standards and avoid penalties.
- Market Advantage: Appeal to eco-conscious consumers and investors.
2. Diversify Supply Chains
- Actions:
- Alternative Suppliers: Source raw materials from multiple regions to reduce dependency.
- Local Production: Establish facilities closer to key markets to minimize transportation risks.
- Benefits:
- Risk Mitigation: Reduce exposure to geopolitical tensions and supply disruptions.
- Cost Savings: Lower transportation costs and improve responsiveness.
3. Focus on Emerging Markets
- Actions:
- Market Entry Strategies: Tailor products and services to meet local needs.
- Partnerships: Collaborate with local companies and governments.
- Benefits:
- Growth Opportunities: Access to untapped markets with high growth potential.
- Competitive Edge: Establish early presence ahead of competitors.
4. Embrace Technological Innovations
- Actions:
- Invest in R&D: Focus on developing advanced alloys and production methods.
- Digital Transformation: Implement automation and data analytics for operational efficiency.
- Benefits:
- Product Differentiation: Offer high-value products with superior properties.
- Efficiency Gains: Reduce costs and improve productivity.
5. Strengthen Partnerships
- Actions:
- Collaborate Across the Value Chain: Work with suppliers, customers, and technology providers.
- Joint Ventures: Explore opportunities for shared investment and risk.
- Benefits:
- Innovation Acceleration: Leverage collective expertise for faster development.
- Market Access: Expand reach through combined networks.
Conclusion
As we navigate the complexities of the global aluminum wire rod market in 2024 and beyond, it becomes evident that the industry is at a pivotal juncture. The convergence of urbanization, technological innovation, and environmental imperatives is reshaping demand and supply dynamics. Aluminum wire rods, with their unique combination of properties, are positioned to play a critical role in the evolution of key sectors such as construction, automotive, aerospace, and renewable energy.
However, the path forward is not without challenges. Supply chain disruptions, price volatility, and stringent regulatory landscapes require strategic foresight and adaptability. Companies must invest in sustainable practices, embrace technological advancements, and cultivate resilience in their operations.
Opportunities abound in emerging markets and burgeoning industries like electric vehicles and 5G technology. By leveraging innovation and strategic partnerships, stakeholders can capitalize on these growth drivers.
Elka Mehr Kimiya, with its commitment to excellence and cutting-edge production capabilities, is poised to meet the evolving needs of the global market. By ensuring top-quality products through precision engineering and rigorous quality control, we stand ready to support infrastructure development and technological progress worldwide.
In this dynamic landscape, success will hinge on the ability to anticipate trends, adapt to changing conditions, and innovate relentlessly. The aluminum wire rod market holds immense potential, and with thoughtful navigation, stakeholders can chart a course towards sustained growth and prosperity.
References
- International Aluminium Institute. (2021). Aluminium Production Statistics. Retrieved from https://www.world-aluminium.org/statistics/
- World Bureau of Metal Statistics. (2021). Metal Statistics 2021. Retrieved from https://www.world-bureau.com/
- United Nations Department of Economic and Social Affairs. (2018). World Urbanization Prospects. Retrieved from https://population.un.org/wup/
- Government of India. (2020). Smart Cities Mission. Retrieved from https://smartcities.gov.in/
- Global Infrastructure Hub. (2017). Global Infrastructure Outlook. Retrieved from https://outlook.gihub.org/
- Grand View Research. (2020). Electrical Wiring and Cable Market Analysis. Retrieved from https://www.grandviewresearch.com/
- International Energy Agency. (2021). Global EV Outlook 2021. Retrieved from https://www.iea.org/
- Ducker Worldwide. (2017). Aluminum Content in North American Light Vehicles. Retrieved from https://www.aluminum.org/
- U.S. Department of Energy. (2011). Vehicle Weight Reduction and Efficiency. Retrieved from https://www.energy.gov/
- Global Wind Energy Council. (2021). Global Wind Report 2021. Retrieved from https://gwec.net/
- International Energy Agency. (2020). Renewables 2020. Retrieved from https://www.iea.org/
- U.S. Geological Survey. (2021). Mineral Commodity Summaries – Bauxite and Alumina. Retrieved from https://www.usgs.gov/
- World Mining Data. (2020). Bauxite Production Statistics. Retrieved from https://www.world-mining-data.info/
- Reuters. (2021). Guinea Political Unrest Raises Bauxite Supply Concerns. Retrieved from https://www.reuters.com/
- Reuters. (2017). China to Cut Aluminium Capacity. Retrieved from https://www.reuters.com/
- Organisation for Economic Co-operation and Development (OECD). (2019). Measuring Distortions in International Markets. Retrieved from https://www.oecd.org/
- U.S. Department of Commerce. (2018). Section 232 Tariffs on Aluminum. Retrieved from https://www.commerce.gov/
- European Commission. (2018). EU Safeguard Measures on Steel and Aluminum. Retrieved from https://trade.ec.europa.eu/
- Metal Bulletin. (2016). Continuous Casting in Aluminum Industry. Retrieved from https://www.metalbulletin.com/
- European Aluminium. (2020). Recycling Aluminium. Retrieved from https://www.european-aluminium.eu/
- European Commission. (2020). Circular Economy Action Plan. Retrieved from https://ec.europa.eu/
- Aluminum Association. (2019). Aluminum Alloys 7000 Series. Retrieved from https://www.aluminum.org/
- International Aluminium Institute. (2020). Global Aluminum Consumption. Retrieved from https://www.world-aluminium.org/
- China Nonferrous Metals Industry Association. (2020). Aluminum Consumption in China. Retrieved from http://www.cnmia.org.cn/
- Indian Minerals Yearbook. (2019). Aluminium and Alumina. Retrieved from https://ibm.gov.in/
- International Aluminium Institute. (2021). Primary Aluminum Production. Retrieved from https://www.world-aluminium.org/
- Rusal. (2020). Annual Report 2020. Retrieved from https://rusal.ru/
- Ministry of Mines, Government of India. (2021). Annual Report 2020-21. Retrieved from https://mines.gov.in/
- U.S. Geological Survey. (2021). Mineral Commodity Summaries. Retrieved from https://www.usgs.gov/
- World Mining Data. (2021). Bauxite Reserves and Production. Retrieved from https://www.world-mining-data.info/
- International Aluminium Institute. (2020). Alumina Production Statistics. Retrieved from https://www.world-aluminium.org/
- International Energy Agency. (2018). Energy Efficiency in Aluminum Production. Retrieved from https://www.iea.org/
- London Metal Exchange. (2018). Aluminum Historical Prices. Retrieved from https://www.lme.com/
- BloombergNEF. (2021). Aluminum Price Forecast. Retrieved from https://about.bnef.com/
- The White House. (2021). Infrastructure Investment and Jobs Act. Retrieved from https://www.whitehouse.gov/
- Aluminium International Today. (2017). Advancements in Continuous Casting. Retrieved from https://aluminiumtoday.com/
- Elysis. (2020). Inert Anode Technology Development. Retrieved from https://elysis.com/
- International Energy Agency. (2020). Global EV Outlook 2020. Retrieved from https://www.iea.org/
- Ericsson Mobility Report. (2021). 5G Subscriptions Forecast. Retrieved from https://www.ericsson.com/
- United Nations Environment Programme (UNEP). (2021). Global Trends in Renewable Energy Investment 2021. Retrieved from https://www.unep.org/
- Mordor Intelligence. (2021). Energy Storage Market – Growth, Trends, and Forecasts. Retrieved from https://www.mordorintelligence.com/





No comment