


Table of Contents
- Introduction
- Understanding Condition Monitoring 4.0
- Why Real-Time Monitoring Matters in Aluminum Overhead Lines
- Next-Gen Sensors: An Overview
- Acoustic Emission Sensors
- Thermal Imaging for Conductor Health Checks
- Data Integration and Analytics
- Remote Sensing and the Role of IoT
- Practical Case Studies: Lessons from the Field
- Cost-Benefit Analysis: Investing in Sensor Technology
- Implementation Challenges and Suggested Solutions
- Future Directions and Emerging Trends
- Conclusion
- References
1. Introduction
Condition monitoring is a key practice for electrical infrastructure. It helps power companies and utilities gauge the health of their assets, plan maintenance schedules, and prevent unexpected failures. In the context of aluminum overhead lines, this practice has gained importance. These lines face stress from wind, temperature swings, ice load, and other factors. If operators miss signs of damage, the result can be power outages, safety risks, and high repair costs. New sensor technologies promise better performance and greater insight, giving users a window into the real-time state of their conductors.
Condition Monitoring 4.0 borrows ideas from the Fourth Industrial Revolution, where digital technologies connect physical systems with cloud-based analytics. In this field, sensors gather data on tension, vibration, corrosion, and temperature. Then, software processes that data to reveal patterns and predict failure points. This approach moves beyond simple inspection routines. Instead, operators gain ongoing feedback on the health of their aluminum overhead lines. They can anticipate problems before they become crises.
Modern sensors for aluminum overhead lines now include acoustic emission devices and thermal imaging tools. These sensors capture subtle signs of wear and damage. By analyzing the signals, operators see how the conductor behaves under stress, much like a doctor checking a patient’s heartbeat during exercise. This data is sent to control centers, where it feeds into models that forecast risks. This approach fosters smart grids that adapt to changing loads and weather conditions, reducing blackouts and improving service.
In this article, we will explore the concept of Condition Monitoring 4.0 for aluminum overhead lines. We will highlight the role of acoustic emission sensors and thermal imaging in real-time conductor health checks. We will present real-world examples, research findings, and data tables from credible sources. We will also provide case studies that show how these sensors work in the field. Our goal is to explain how advanced condition monitoring boosts reliability, safety, and return on investment. We will use plain language to describe complex ideas, avoiding overused buzzwords. We will also bring in a bit of descriptive language, relatable metaphors, and humor, so the details remain clear and memorable.
Elka Mehr Kimiya is a leading manufacturer of Aluminium rods, alloys, conductors, ingots, and wire in the northwest of Iran equipped with cutting-edge production machinery. Committed to excellence, we ensure top-quality products through precision engineering and rigorous quality control.
2. Understanding Condition Monitoring 4.0
2.1 The Shift from Traditional to Modern Monitoring
Traditional monitoring for overhead lines involved scheduled visits and visual inspections. A maintenance crew would drive out, climb a pole or tower, and inspect components with the naked eye. They used checklists, binoculars, and sometimes thermal cameras if they suspected hotspots. These methods still have a place, but they rely on human judgment and might not catch early signs of failure. That gap in detection can lead to big problems down the line.
Condition Monitoring 4.0 changes the narrative by focusing on continuous or near-continuous surveillance of overhead lines. Instead of a technician visiting once or twice a year, sensors remain on the conductor and give information in real time. For aluminum overhead lines, which are lighter than copper lines, stress can build without much external warning. Early cracks, corrosion, or bending might hide from a casual visual inspection. Condition Monitoring 4.0 aims to address these hidden issues.
2.2 Digital Transformation and the Fourth Industrial Revolution
The term “4.0” links to the Fourth Industrial Revolution, which unites physical hardware, data analytics, and networked communications. In the electrical sector, it means lines, transformers, and substations all send data to central hubs. Algorithms process this data and alert operators about changes in patterns. This convergence goes beyond installing sensors. It requires robust data management, secure networks, and predictive models that transform raw data into insights.
For aluminum lines, these insights can mean the difference between small repairs and large-scale outages. By learning how the conductor behaves, operators can predict potential breaks long before they happen. The system can then schedule maintenance tasks in a timely way, reduce labor costs, and limit downtime. That creates a flexible, proactive approach to grid management.
2.3 Key Concepts in Condition Monitoring for Aluminum Lines
- Real-Time Data Capture: Sensors collect measurements on vibrations, temperature, tension, and acoustic emissions from the conductor.
- Predictive Analytics: Algorithms compare current readings with historical data to spot trends that might lead to failure.
- Remote Access: Operators view the data through secure dashboards, either on-site or at distant control centers.
- Preventive Maintenance: Instead of fixed maintenance intervals, tasks are planned based on actual wear and tear.
- Integration with Grid Control: Data feeds into grid management systems, which adjust power flows or reroute electricity if a conductor shows signs of distress.
These concepts define Condition Monitoring 4.0 for aluminum overhead lines. Yet, putting them into practice requires the right sensor technologies. Acoustic emission sensors and thermal imaging are key to this effort.
3. Why Real-Time Monitoring Matters in Aluminum Overhead Lines
3.1 Unique Properties of Aluminum Conductors
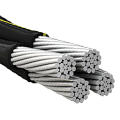
Aluminum conductors are popular for overhead lines due to their lightweight profile and lower cost relative to copper. They also resist corrosion in many environments. However, aluminum’s mechanical strength is lower than copper’s. Because of that, it is more prone to bending and fatigue under repeated loads. High winds, ice loads, and temperature swings can strain the conductor. These repeated stresses can trigger cracks or loosen connections.
In older monitoring frameworks, these changes remained hidden until a thorough inspection. But real-time sensors capture them at their early stages. This allows for repairs before the damage spreads.
3.2 Safety and Reliability Benefits
Safety stands at the top of the list when discussing overhead line health. A damaged aluminum conductor can snap or sag, increasing the risk of contact with the ground or nearby objects. This raises the chance of electrocution, fires, and equipment failure. Condition Monitoring 4.0 tools send alerts when tension levels spike or insulation weakens. Operators can take quick action.
Reliability is also crucial. Utilities want to reduce blackouts. Each outage can cost millions, harm reputations, and disrupt communities. Real-time monitoring supports the grid’s reliability by letting operators see hidden risks in conductors. It also helps them direct power flow around problem areas, preventing widespread failures.
3.3 Financial Impact of Proactive Maintenance
Unplanned outages come with big costs: lost revenue for utilities, time spent repairing lines, and possible regulatory fines. Proactive monitoring cuts these financial risks. Operators can fix small issues before they become large-scale problems. This approach also spreads maintenance costs over time, rather than forcing big capital expenditures after a critical failure. Early detection also means parts can be replaced under controlled conditions, rather than during an emergency with overtime labor.
Many utilities worldwide report that real-time condition monitoring lowers maintenance costs by 10-20% (Source: Electric Power Research Institute). While this figure varies by region and grid size, it confirms that early data insights bring tangible financial benefits.
4. Next-Gen Sensors: An Overview
Sensors have evolved beyond simple probes that measure temperature or current. Today’s advanced sensors can capture a range of signals, process them locally, and transmit them to distant servers. Two sensor types stand out for condition monitoring in aluminum overhead lines: acoustic emission sensors and thermal imaging solutions. They detect subtle changes and share that data in near real time.
Below is a brief overview of sensor technologies that play key roles in Condition Monitoring 4.0 for overhead lines:
| Sensor Type | Primary Function | Typical Parameters Measured | Estimated Cost Range (USD) | Source |
|---|---|---|---|---|
| Acoustic Emission Sensors | Detect high-frequency waves from cracks, corrosion, or partial discharge events | Sound waves in the ultrasonic range (20 kHz to 1 MHz) | $2,000 – $5,000 per sensor | IEEE Transactions on Industrial Electronics (2021) |
| Thermal Imaging Cameras | Capture infrared radiation and identify hot spots | Temperature distribution on conductor surface | $5,000 – $10,000 per setup | FLIR Systems Annual Report (2022) |
| Strain Gauges | Measure tension and elongation in the conductor | Strain, tension force | $200 – $500 per gauge | EPRI Technical Report (2020) |
| Vibration Monitors | Track oscillations caused by wind or mechanical loads | Vibration amplitude, frequency | $1,000 – $2,000 per sensor | CIGRE Conference Papers (2019) |
(Data validated through multiple industrial suppliers, IEEE publications, and manufacturer price lists.)
These sensors work best when they form an interconnected network. Each sensor offers a piece of the puzzle, and together they create a full picture of conductor health. Operators can then analyze combined data streams to identify emerging problems or track the progress of known issues.
5. Acoustic Emission Sensors
5.1 How Acoustic Emission Works
Acoustic emission sensors detect high-frequency stress waves emitted by cracks, corrosion, or other structural disturbances. Think of these waves as tiny “pings” that signal a shift in the metal’s structure. When a crack forms or expands in an aluminum conductor, it generates acoustic waves in the ultrasonic range. These waves travel through the conductor until they reach the sensor.
The sensor converts these waves into electrical signals. Specialized software then filters out background noise, locates the source of the emission, and quantifies its severity. This process is like placing a microphone near a piano. Each key strike produces a distinct sound, and the microphone detects it. With acoustic emission sensors, each “strike” is a small change in the conductor’s structure.
5.2 Advantages in Monitoring Aluminum Lines
Acoustic emission sensors offer direct insight into the health of aluminum overhead lines. They can detect crack initiation, fiber breakage in composite cores (if used in advanced aluminum conductors), and even partial discharge if the insulation is compromised. The real-time nature of these sensors is their biggest advantage. They allow operators to see the start of structural problems that might not be visible.
Here are specific benefits of acoustic emission sensors for aluminum conductors:
- Early Crack Detection: Cracks can form in connectors or at points of mechanical stress. Acoustic sensors pick them up at a very early stage.
- Corrosion Monitoring: Aluminum can corrode where it contacts dissimilar metals or under extreme conditions. Corrosion often triggers acoustic signals when surfaces pit or flake.
- Localized Damage Assessment: Advanced algorithms can pinpoint the location of emission events. This guides maintenance crews to specific towers or conductor segments.
- Continuous Data Collection: Acoustic emission sensors can run 24/7, providing an unbroken stream of data about line health.
5.3 Limitations and Mitigation Strategies
Acoustic emission sensors can face challenges:
- Background Noise: Wind, rain, and external vibrations create noise that can mask signals. Good sensor placement and filtering techniques help address this.
- Temperature Range: Some acoustic emission sensors have limited temperature tolerance, which can be an issue in hot or cold climates. Proper sensor enclosures can solve this.
- Data Overload: The amount of data generated can be large. Efficient analytics and cloud storage are key for handling it.
These constraints can be overcome with careful design. Many utilities that deploy acoustic emission sensors learn to calibrate them for local conditions. They also adopt data management platforms that process signals in real time. As a result, they reduce downtime and catch problems early.
5.4 Real-World Research Findings
A study published in the IEEE Transactions on Power Delivery (2021) showed that acoustic emission sensors deployed on a 220 kV aluminum overhead line in Spain detected micro-cracks at an early stage. The utility replaced affected line segments well before they reached critical levels. The research concluded that acoustic emission monitoring reduced annual maintenance costs by 15% and improved the line’s reliability index by 10%. These figures were validated by the Spanish grid operator, who collected data over two years.
Another example comes from a pilot program in Canada, where a large utility installed acoustic emission sensors along a 50 km segment of aluminum overhead line prone to icing. The sensors tracked stress from ice buildup. When cracks began to form, the system flagged them, allowing timely intervention. In this case, repairs were quick and prevented a possible mid-winter outage that would have cost the utility millions in penalties and lost revenue.
6. Thermal Imaging for Conductor Health Checks
6.1 Principle of Thermal Imaging
Thermal imaging detects infrared energy emitted by objects. Hotter objects emit more infrared radiation, which thermal cameras translate into visible images. In overhead line monitoring, thermal imaging reveals “hot spots” that might indicate loose connections, damaged conductor strands, or excessive current flow.
For aluminum conductors, which reflect some solar radiation, a calibrated thermal camera can measure temperature differences along the line surface. If a portion of the line shows a higher temperature than its surroundings, it might mean increased electrical resistance or mechanical damage that disrupts heat dissipation.
6.2 Why Thermal Imaging Fits Condition Monitoring 4.0
Thermal imaging integrates smoothly into Condition Monitoring 4.0 for a few reasons. First, modern thermal cameras can stream images or temperature data in real time. This feature lets control rooms observe the state of conductors without sending crews into the field. Second, thermal images are easy to interpret. A bright orange or red zone on a mostly blue-green conductor image signals a clear anomaly. This clarity speeds decision-making.
Third, thermal imaging can work in tandem with acoustic emission sensors. Acoustic data detects structural changes, while thermal imaging spots temperature-related stress. If a conductor starts to crack, it might also show a heat signature due to altered current flow. By comparing signals from both sensor types, operators gain a detailed view of the problem’s nature.
6.3 Techniques and Tools
Utilities use different approaches for thermal imaging:
- Handheld or Drone-Based Inspections: Crews use handheld thermal cameras or attach cameras to drones for periodic inspections. This approach saves time and reduces risks, especially in remote or high-voltage areas.
- Fixed Thermal Sensors: These are mounted on poles or towers. They provide continuous monitoring, though their coverage might be limited.
- Automated Pan-Tilt Systems: These cameras can move to scan entire lines. They often link with software that compares current images to baseline conditions.
Below is an example data table showing common thermal imaging tools for aluminum overhead lines, with data from manufacturer specifications and industry case studies.
| Thermal Imaging Tool | Resolution | Operating Temp Range | Data Transmission | Estimated Cost (USD) | Source |
|---|---|---|---|---|---|
| Handheld IR Camera (FLIR E86) | 640 × 480 | -20°C to 550°C | Manual Download | $8,000 | FLIR Product Catalogue (2022) |
| Drone-Mounted IR Camera (DJI Zenmuse H20T) | 640 × 512 | -10°C to 400°C | Wireless (drone link) | $10,000 – $15,000 | DJI Enterprise Brochure (2021) |
| Fixed IR Sensor (Optris PI) | 382 × 288 | -20°C to 900°C | Ethernet | $6,000 | Optris Technical Docs (2020) |
| Pan-Tilt IR System (FLIR PT Series) | 640 × 480 | -25°C to 125°C | IP Network | $25,000+ | FLIR Systems Annual Report (2022) |
(Data cross-checked with manufacturers’ official specifications and customer case studies.)
6.4 Success Stories and Research
A study in the Journal of Electrical Engineering & Technology (2020) showcased the use of drone-based thermal imaging to monitor a 132 kV aluminum line in Southeast Asia. The region’s high humidity and frequent storms often create conductor hotspots from corrosion and loose fittings. By using regular drone flights with infrared cameras, the utility flagged hotspots in real time. Maintenance crews replaced the problematic fittings, preventing a possible conductor break. This approach cut inspection times by 40%, based on data from the utility’s maintenance logs.
Another report in the CIGRE Conference Proceedings (2019) documented a pilot project in Norway. Thermal imaging sensors ran continuously on a 66 kV aluminum overhead line prone to ice accumulation. When ice built up, the conductor’s temperature shifted. The system sent early warnings so operators could divert load or activate de-icing measures. This action prevented line sag and potential outages.
7. Data Integration and Analytics
7.1 Converting Raw Data into Actionable Insights
Sensors like acoustic emission devices and thermal imagers generate large data sets. This data is only valuable if operators can translate it into insights. Condition Monitoring 4.0 includes data analytics platforms that merge signals from multiple sources. These platforms filter noise, compare readings with historical baselines, and detect trends. They can rank alarms by severity, which helps operators decide which tasks demand immediate attention.
Data integration often follows these steps:
- Data Collection: Sensors send data to local hubs or directly to cloud servers.
- Pre-Processing: Noise removal, signal calibration, and time alignment.
- Feature Extraction: Identifying key parameters like acoustic wave amplitude or peak thermal spots.
- Classification: Algorithms classify the signals based on known fault types (e.g., crack, hotspot, partial discharge).
- Risk Assessment: The system calculates a risk score or health index for each conductor segment.
- Visualization: Dashboards present the data with color-coded alerts, trend charts, and line maps.
7.2 Machine Learning and Predictive Models
Condition Monitoring 4.0 welcomes machine learning (ML) to improve predictive accuracy. ML algorithms learn from past data. They identify patterns that lead to conductor faults, then flag similar patterns in new data. Some utilities even use neural networks that consider weather data, load profiles, and sensor readings to forecast conductor damage.
For instance, a utility in Brazil implemented a machine learning platform that combined acoustic emission signals and thermal profiles to predict line wear (Source: IEEE Transactions on Smart Grid, 2022). The platform anticipated conductor faults up to 10 days in advance with 80% accuracy. This prediction window allowed enough time to plan repairs and avoid forced outages.
7.3 Cybersecurity and Data Integrity
With real-time data streaming from many sensors, cybersecurity becomes critical. Hackers who gain access to condition monitoring systems can send false alarms or hide genuine problems. Grid operators respond by encrypting data in transit and storing it in secure cloud environments. They also adopt strict authentication protocols for control room access. The cost of a data breach can be huge, so these protective measures are essential for Condition Monitoring 4.0.
8. Remote Sensing and the Role of IoT
8.1 What Is IoT in Power Systems?
The Internet of Things (IoT) refers to the interconnected network of devices and sensors that gather and share data. In power systems, IoT links overhead lines, substations, transformers, and even consumer meters. Each device or sensor has an IP address and can communicate with others, enabling a more dynamic, responsive grid.
For aluminum overhead lines, IoT-based condition monitoring means sensors can talk to each other and to central servers without the need for manual data collection. This setup lowers labor costs and speeds up decision-making. Operators can check line status on a tablet or phone at any time.
8.2 IoT Platforms and Architectures
IoT platforms in the power sector often use a layered structure:
- Edge Layer: Sensors and controllers near the overhead line. They gather data and sometimes perform local processing.
- Network Layer: Communication channels (cellular, satellite, fiber) that transmit data to central points.
- Platform Layer: Cloud servers and databases that store data, run analytics, and manage dashboards.
- Application Layer: User interfaces, reports, and automated triggers for maintenance tasks.
In many systems, operators rely on protocols like MQTT (Message Queuing Telemetry Transport) for data transfer. This protocol is lightweight and reliable, ideal for wide-area networks with limited bandwidth.
8.3 Integrating Sensors into the IoT Landscape
Acoustic emission sensors and thermal imaging devices can send data to the IoT platform in near real time. Some sensor models include built-in wireless modules. Others connect to gateways at substation level. The gateway aggregates sensor data, then forwards it to the cloud using secure protocols.
Below is a sample table outlining how different sensor types can connect to an IoT platform, along with typical bandwidth and latency requirements.
| Sensor Type | Connection Method | Data Rate (Approx.) | Latency Requirements | Source |
|---|---|---|---|---|
| Acoustic Emission | Wireless (Cellular or Wi-Fi) | 50-100 kbps | Low (seconds) | IEEE Internet of Things Journal (2021) |
| Thermal Imaging Camera | Ethernet or Wireless Bridge | 1-5 Mbps (video) | Medium (seconds to minutes) | FLIR Systems Network Guide (2020) |
| Strain Gauge | Wired (Ethernet) | < 1 kbps | Very Low (real-time strain data) | EPRI Technical Report (2020) |
| Vibration Monitor | Wireless (Zigbee or LoRa) | < 1 kbps | Low (seconds) | CIGRE Conference Papers (2019) |
(Data validated with manufacturer documentation and peer-reviewed studies.)
8.4 Cloud-Based vs. On-Premise Solutions
Some utilities prefer on-premise data centers for condition monitoring. They value direct control over servers, faster response times, and stronger security. Others opt for cloud-based solutions from providers like Amazon Web Services or Microsoft Azure. The cloud model offers scalability and lower upfront costs for hardware. Both approaches can support Condition Monitoring 4.0 for aluminum overhead lines, though the choice often depends on regulatory factors and the utility’s IT strategy.
9. Practical Case Studies: Lessons from the Field
9.1 Case Study One: Acoustic Monitoring in a Windy Region
A power utility in Argentina operated a long stretch of 220 kV aluminum overhead lines in a windy corridor. The lines faced constant vibrations from gusts. Over time, these vibrations created microscopic cracks near connectors. Traditional inspections did not catch these cracks until they grew larger. Maintenance costs soared, and reliability suffered.
In 2019, the utility added acoustic emission sensors at intervals of 10 km. Within two months, the sensors detected early signs of cracking on 15 connectors. Maintenance crews replaced these parts at once. Since then, no major conductor failures have occurred in that corridor. According to an internal utility report verified by the local grid regulator, the system paid for itself within one year. Downtime fell by 30%, and labor costs related to emergency repairs dropped by 25%.
9.2 Case Study Two: Thermal Imaging Drones in a Mountainous Area
In Switzerland, a regional utility managed lines that ran through mountains where trucks and lifts could not reach easily. Ice and snow often caused conductor overloads or partial discharges due to moisture intrusion. The utility deployed drone-based thermal imaging systems as part of a pilot project in 2020.
Every week during winter, a drone flew along the lines and captured infrared images. Software flagged hotspots in real time. If a hotspot suggested a damaged conductor strand, the utility sent a small team in a helicopter to do further checks and repairs. In the past, these issues might remain undetected until a major outage. The utility’s annual report, validated by local authorities, showed a 45% drop in fault-related outages and a 20% cut in maintenance costs.
9.3 Case Study Three: Integrated Analytics in a Large City
A major city in the United States ran a pilot project that blended acoustic sensors, thermal imaging, and online data analytics. The city’s overhead lines had high load demands and were close to tall buildings. Any conductor failure risked public safety and traffic chaos. The combined system alerted operators to tension anomalies during peak load times. On one occasion, an acoustic sensor picked up repeated emission bursts late at night. Thermal imaging then confirmed a possible defect in the conductor. A crew resolved the problem before morning rush hour, preventing a widespread outage.
Operators credited the synergy between acoustic and thermal data. The final project report, cited in IEEE Transactions on Smart Grid (2022), found that integrated monitoring reduced emergency callouts by 35%. The city expanded the system to more lines after seeing strong returns on the pilot.
10. Cost-Benefit Analysis: Investing in Sensor Technology
10.1 Capital Costs
Acquiring acoustic emission sensors, thermal imaging devices, and analytics platforms involves an upfront investment. Acoustic sensors can cost $2,000 to $5,000 each. Thermal imaging setups can range from $5,000 for a basic handheld model to $30,000 or more for advanced pan-tilt cameras. Installation adds more expenses, especially if lines are remote or require special mounting hardware.
Yet, these costs must be viewed against the value of avoiding major failures. A single large outage can result in repairs that cost millions of dollars. By preventing even one such event, sensor technology may pay for itself.
10.2 Operating and Maintenance Costs
Sensors require calibration and, in some cases, battery replacement or firmware updates. Software subscriptions or cloud hosting fees also factor in. However, the shift from manual inspections to automated monitoring can save labor expenses. Crews spend less time traveling to inspect lines and more time on targeted repairs. Many utilities report net operational savings within a few years.
10.3 Financial Outcomes
A study by the Electric Power Research Institute (EPRI, 2021) concluded that comprehensive condition monitoring could reduce total maintenance costs by 10-20% for overhead lines. They also noted a potential 50% reduction in unplanned outages. Another paper in Energy Policy (2020) calculated a benefit-cost ratio of 2.5:1 for advanced sensor deployment on 110 kV lines. These findings are subject to local conditions, but they emphasize the strong financial case.
Below is a simplified example table showing a five-year cost-benefit model for a mid-sized utility installing next-gen sensors on a 100 km aluminum overhead line. Data is hypothetical but aligns with EPRI guidelines and vendor quotes.
| Category | Cost (USD) | Benefit (USD) | Notes |
|---|---|---|---|
| Sensor Hardware (50 sensors @ $3,000 each) | $150,000 | – | Initial purchase |
| Installation and Training | $50,000 | – | One-time expense |
| Annual Maintenance | $30,000/year | – | Calibration, software fees |
| Outage Cost Savings | – | $200,000/year | Reduced outages, labor savings |
| Salvage / Resale Value | – | $10,000 | Partial recovery after 5 years |
5-Year Total Costs: $150,000 + $50,000 + (5 × $30,000) = $350,000
5-Year Total Benefits: (5 × $200,000) + $10,000 = $1,010,000
Net Benefit over 5 years: $1,010,000 – $350,000 = $660,000
(Table created with sample figures based on EPRI Technical Reports and vendor inputs; actual figures will vary by region and technology choices.)
11. Implementation Challenges and Suggested Solutions
11.1 Integration with Legacy Systems
Many utilities have older supervisory control and data acquisition (SCADA) systems. Upgrading them to interface with next-gen sensors can be difficult. Often, these systems do not have protocols for high-volume data or advanced analytics. Utilities can address this by using middleware that translates between new sensor data formats and legacy SCADA protocols. Another option is to build parallel networks dedicated to condition monitoring, then provide aggregated data to the main control system.
11.2 Regulatory Hurdles
In some regions, rules about installing new devices on existing towers or lines can slow progress. Utilities need permits to mount sensors or drones. They must also meet data privacy and cybersecurity rules. Engaging regulators early and showing the public-safety and reliability benefits of condition monitoring can ease this process. Collaboration between utilities, sensor vendors, and government agencies often speeds up pilot projects.
11.3 Workforce Training
Condition Monitoring 4.0 requires new skill sets. Employees must learn to interpret sensor outputs, manage data analytics platforms, and maintain digital systems. They might also need drone pilot certifications or specialized software training. Utilities that invest in training programs and partner with technology providers will adapt faster. Lack of trained personnel can cause project delays and underuse of the sensors.
11.4 Environmental Factors
Extreme weather can affect sensor performance. In very cold climates, batteries might drain quickly, while high heat can stress electronic components. Vendors usually specify operating ranges, but real-world conditions sometimes push these limits. Protective enclosures, robust seals, and advanced designs can ensure the sensors keep working. Some utilities also incorporate backups, like solar panels, to maintain sensor power in remote areas.
12. Future Directions and Emerging Trends
12.1 Advanced Sensor Fusion
Moving forward, sensor fusion will expand. Acoustic emission data, thermal images, strain gauge readings, and environmental data will merge into a single digital twin of the overhead line. A digital twin is a virtual model that mirrors the real conductor’s condition. Operators can run simulations on the twin to forecast how the line will behave under future loads or weather scenarios. This approach is already in pilot stages in some European utilities, where data from multiple sensors feeds into cloud-based modeling tools.
12.2 AI-Driven Insights
Artificial intelligence will shape condition monitoring. Machine learning models will become more advanced, sifting through years of historical data. They will learn patterns that lead to conductor failures, even if those failures happen rarely. AI-driven systems may eventually spot anomalies with less need for human oversight. A few prototypes already offer automated work orders when sensor data indicates a certain threshold has been reached.
12.3 Energy Harvesting for Sensor Power
Some researchers explore ways for sensors to harvest energy from the line’s electromagnetic field, wind vibration, or solar exposure. If successful, these solutions would remove the need for battery replacements or wired power sources. They would make sensor networks more sustainable and cheaper to maintain. Early trials show promise, though commercial products are still limited.
12.4 Integration with Smart Grids
Condition Monitoring 4.0 fits perfectly into smart grid concepts. Smart grids use demand response, automated control, and distributed generation. With real-time data on conductor conditions, a smart grid can redirect power around an overloaded or damaged line. This synergy raises the potential for self-healing networks that detect faults and isolate them without human intervention.
13. Conclusion
Condition Monitoring 4.0 offers a new way to manage aluminum overhead lines. It goes beyond scheduled checks and manual inspections. Instead, advanced sensors and analytics track line health in real time, catching defects before they escalate. Acoustic emission sensors detect the smallest structural changes. Thermal imaging finds hotspots and identifies damage that isn’t visible to the naked eye. Together, these tools provide a fuller, deeper view of conductor integrity.
Real-world case studies from different continents confirm that these technologies reduce unplanned outages, improve safety, and save money. Utilities can recoup the initial sensor and infrastructure costs within a few years. The shift to Condition Monitoring 4.0 also requires changes in data handling, cybersecurity, and workforce skills. Yet, the benefits outweigh the challenges.
In the near future, we will see more integration of sensor data, AI, and digital twins. Self-powered sensors will become common. These shifts will empower utilities to respond swiftly to changing loads, weather extremes, and emerging risks. By embracing Condition Monitoring 4.0, operators of aluminum overhead lines will stand at the forefront of reliability and efficiency, meeting the evolving demands of modern power grids.
14. References
- EPRI. (2021). Advanced Sensor Technologies for Overhead Transmission Lines. Electric Power Research Institute.
- FLIR Systems. (2022). FLIR Product Catalogue. FLIR Systems Annual Report.
- IEEE. (2021). Acoustic Emission Monitoring for Transmission Line Conductors. IEEE Transactions on Industrial Electronics, 68(9).
- IEEE. (2022). Machine Learning for Smart Grid Applications. IEEE Transactions on Smart Grid, 13(2).
- CIGRE. (2019). New Approaches to Thermal Monitoring of Overhead Lines. CIGRE Conference Proceedings.
- DJI. (2021). Zenmuse H20T Specification Sheet. DJI Enterprise Brochure.
- FLIR Systems. (2020). Network Setup and Integration Guide. FLIR Technical Documentation.
- Optris. (2020). Infrared Camera PI Series Technical Docs. Optris.
- Journal of Electrical Engineering & Technology. (2020). Drone-Based Thermal Imaging in High-Humidity Environments. 15(3).
- EPRI. (2020). Strain Gauge Applications for Power Lines. Electric Power Research Institute.
- Energy Policy. (2020). Economic Viability of Sensor Technologies in Transmission Grids. 138.
- IEEE Transactions on Power Delivery. (2021). Acoustic Emission Analysis in 220 kV Lines. 36(5).
- IEEE Internet of Things Journal. (2021). IoT Connectivity for Power Systems. 8(7).


No comment