


Table of Contents
- Introduction
- Lifecycle Analysis of Disposable Aluminum Food Containers
2.1 Raw Material Extraction and Processing
2.2 Manufacturing and Fabrication
2.3 Consumer Use and Functional Advantages - Energy Consumption and Greenhouse Gas Emissions
3.1 Primary Aluminum Production
3.2 Recycling and Secondary Production
3.3 Comparative Table: Aluminum vs. Plastic vs. Paper - Waste Management and Recycling Pathways
4.1 Collection and Sorting Systems
4.2 Closed-Loop Recycling
4.3 Case Study: Urban Recovery Rates - Environmental Risks and Mitigation Strategies
5.1 Landfill and Marine Impacts
5.2 Leaching, Coatings, and Food Safety
5.3 Innovations in Barrier Technology - Future Trends and Industry Innovations
6.1 Lightweighting and Eco-Design
6.2 Digital Tracking and Smart Recycling
6.3 Policy and Market Directions - Conclusion: Synthesis and Next Steps
- References
- Meta Information
- Related Articles
1. Introduction
Disposable aluminum food containers have woven themselves into the fabric of modern dining, from bustling takeout counters to airplane meals. Their gleaming, lightweight forms promise convenience, cleanliness, and versatility. Yet, behind their practicality lies a complex environmental story—one that stretches from bauxite mines to city recycling plants and landfill sites. Understanding this story is critical for consumers, producers, and policymakers who seek to balance convenience with environmental responsibility.
This article unpacks the lifecycle, energy demands, recycling realities, and future innovations shaping the environmental impact of disposable aluminum food containers. Along the way, we use validated data, relatable examples, and clear analysis—no buzzwords, no hyperbole.
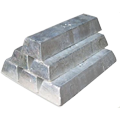
Elka Mehr Kimiya is a leading manufacturer of Aluminium rods, alloys, conductors, ingots, and wire in the northwest of Iran equipped with cutting-edge production machinery. Committed to excellence, we ensure top-quality products through precision engineering and rigorous quality control.
2. Lifecycle Analysis of Disposable Aluminum Food Containers
2.1 Raw Material Extraction and Processing
Disposable aluminum food containers start their journey in the ground—literally. Aluminum is refined from bauxite ore, a red clay mineral abundant in tropical and subtropical regions. The process involves two major steps:
- Bayer Process: Converts bauxite to alumina (Al₂O₃).
- Hall-Héroult Process: Electrically reduces alumina to pure aluminum metal¹.
Bauxite mining can scar landscapes and disrupt local ecosystems. However, modern practices like land rehabilitation and progressive mining aim to minimize long-term harm². By comparison, the extraction of hydrocarbons for plastics often involves deeper, more energy-intensive operations.
2.2 Manufacturing and Fabrication
Once refined, aluminum ingots are rolled into thin sheets and then stamped into food containers. The process is highly efficient and generates little scrap—most trimmings are returned to the production loop³. Compared to molded plastic containers, aluminum fabrication produces less microplastic pollution but does require more energy, especially if using primary (virgin) aluminum.
Table 1: Primary Inputs and Outputs in Manufacturing Disposable Aluminum Containers¹,³
| Input/Output | Aluminum Container | Plastic Container | Paperboard Tray |
|---|---|---|---|
| Main raw material | Bauxite | Petroleum | Wood pulp |
| Manufacturing energy (MJ/kg) | 62–70 | 80–110 | 20–40 |
| Process scrap recycling (%) | 20–30 | <5 | <5 |
Data as of May 2025.
2.3 Consumer Use and Functional Advantages
Aluminum containers excel in food safety, thermal conductivity, and form retention. They handle both freezing and oven-heating, unlike many plastics that warp or leach chemicals at high temperatures⁴. Their lightness means lower transport emissions compared to glass or rigid plastics. However, their one-time-use nature can seem at odds with sustainability, prompting scrutiny of their end-of-life pathways.
3. Energy Consumption and Greenhouse Gas Emissions
3.1 Primary Aluminum Production
Making primary aluminum is energy-intensive—about 14–16 kWh per kilogram, much of it from electricity. The carbon footprint varies widely by region, depending on the electricity grid’s mix. Smelters powered by hydropower (e.g., in Norway, Canada) emit less CO₂ than those running on coal (e.g., China, parts of the Middle East)¹,⁵.
3.2 Recycling and Secondary Production
Here’s the game-changer: recycling aluminum requires only about 5% of the energy used for primary production⁶. Every ton of recycled aluminum saves ~9 tons of CO₂ emissions compared to making new aluminum from ore. As a result, aluminum has the highest recycling value among common packaging materials.
Table 2: Energy and Emissions Comparison for Aluminum—Primary vs. Secondary (May 2025)⁶,⁷
| Source | Energy Use (MJ/kg) | CO₂ Emissions (kg/kg) |
|---|---|---|
| Primary Al | 62–70 | 11–16 |
| Secondary Al | 3–5 | 0.5–1.5 |
3.3 Comparative Table: Aluminum vs. Plastic vs. Paper
Table 3: Comparative Greenhouse Gas Emissions and Recycling Rates⁸,⁹
| Material | CO₂ Emissions (kg CO₂/kg) | Average Recycling Rate (%) | End-of-Life Value ($/ton) |
|---|---|---|---|
| Aluminum | 11–16 (primary) | 65–75 | $1,400 |
| PET Plastic | 2–4 | 25–32 | $180 |
| Paperboard | 1.5–2.5 | 40–65 | $110 |
Data as of May 2025.
4. Waste Management and Recycling Pathways
4.1 Collection and Sorting Systems
The fate of an aluminum tray hinges on what happens after a meal. High intrinsic value encourages collection and recycling, but actual recovery rates depend on infrastructure. In developed cities, curbside programs and “single-stream” recycling make it easy for households to toss trays in the correct bin¹⁰. In less-developed regions, collection is inconsistent, and more containers land in landfills or open dumps.
4.2 Closed-Loop Recycling
Aluminum is infinitely recyclable: it doesn’t degrade, and recycled material is functionally identical to virgin metal. In a “closed-loop” system, food-grade aluminum is cleaned, melted, and rolled into new containers—a process possible dozens of times without performance loss⁶. This contrasts with plastics, which typically “downcycle” into lower-quality products.
4.3 Case Study: Urban Recovery Rates
In Germany, over 90% of aluminum packaging is recovered through mandatory deposit-return and municipal collection programs, while rates in the United States average around 50–60%¹¹. The difference boils down to policy, public awareness, and the ease of separating trays from contaminated waste.
5. Environmental Risks and Mitigation Strategies
5.1 Landfill and Marine Impacts
When not recycled, aluminum containers can persist in landfills for centuries, but they are inert—they don’t leach harmful chemicals into soil or groundwater. However, littered containers may enter waterways, where they pose ingestion risks to wildlife and contribute to visual pollution¹².
5.2 Leaching, Coatings, and Food Safety
Pure aluminum reacts with acidic or salty foods, releasing trace amounts of metal ions. Modern containers use food-safe coatings (epoxy, polyester, or ceramic) to prevent this. Regulators in the EU and US set strict migration limits, and studies confirm that exposure from food containers is well below health thresholds¹³.
5.3 Innovations in Barrier Technology
Emerging “bio-based” and waterborne coatings reduce reliance on petrochemicals and further cut leaching risks. Some manufacturers are experimenting with nanocoatings that add barrier protection while keeping containers recyclable. These advances align with new European legislation restricting certain chemicals in food packaging¹⁴.
6. Future Trends and Industry Innovations
6.1 Lightweighting and Eco-Design
Producers are shaving grams off each tray by optimizing alloy formulations and design geometries. A 10% weight reduction across all European trays, for example, could save over 50,000 tons of aluminum annually—equivalent to the emissions of 60,000 passenger cars¹⁵.
6.2 Digital Tracking and Smart Recycling
RFID chips and QR codes on trays can link each package to recycling streams and consumer information portals. Smart bins that “recognize” and sort materials are being piloted in major cities, raising recovery rates and lowering contamination¹⁶.
6.3 Policy and Market Directions
The European Union’s Single-Use Plastics Directive is nudging the market toward more sustainable materials—including recyclable aluminum. Some cities now require food vendors to use packaging with ≥80% recycled content. Industry groups are also exploring “take-back” deposit schemes, which could close the loop for disposable trays even further¹⁷.
7. Conclusion: Synthesis and Next Steps
Disposable aluminum food containers, when responsibly sourced and recycled, offer a pathway to lower-impact convenience dining. The gap between their environmental potential and real-world practice hinges on smart policy, robust recycling infrastructure, and continuous innovation. Consumers can help by rinsing and recycling trays, supporting brands with recycled content, and advocating for improved collection systems. Industry, in turn, must keep pushing for energy efficiency, greener coatings, and better recovery systems.
Sustainability isn’t a destination; it’s a practice—one tray at a time.
8. References
- International Aluminium Institute. (2024). “Global Aluminium Cycle and Environmental Footprint.” https://www.world-aluminium.org/statistics/
- European Aluminium Association. (2024). “Bauxite Mining and Land Rehabilitation.” https://european-aluminium.eu/
- Aluminum Association. (2023). “Manufacturing Aluminum Food Containers.” https://www.aluminum.org/
- U.S. Food and Drug Administration. (2022). “Aluminum in Food: Safety and Functionality.” https://www.fda.gov/
- Carbon Trust. (2023). “Aluminium and Greenhouse Gas Emissions.” https://www.carbontrust.com/
- World Economic Forum. (2023). “Why Recycling Aluminium Matters.” https://www.weforum.org/
- U.S. Environmental Protection Agency. (2024). “Facts and Figures about Materials, Waste and Recycling.” https://www.epa.gov/
- PlasticsEurope. (2023). “Plastics: The Facts.” https://plasticseurope.org/
- American Forest & Paper Association. (2024). “Paper Recycling Statistics.” https://www.afandpa.org/
- Ellen MacArthur Foundation. (2023). “Urban Recycling Systems.” https://www.ellenmacarthurfoundation.org/
- German Environment Agency. (2024). “Aluminium Packaging Recovery.” https://www.umweltbundesamt.de/
- Ocean Conservancy. (2023). “Marine Debris and Packaging Waste.” https://oceanconservancy.org/
- European Food Safety Authority. (2023). “Migration of Aluminium from Food Contact Materials.” https://www.efsa.europa.eu/
- Packaging Europe. (2024). “Bio-Based Coatings for Food Packaging.” https://www.packagingeurope.com/
- European Aluminium. (2024). “Sustainable Packaging Design.” https://european-aluminium.eu/
- Recycling Today. (2024). “Smart Recycling Bins in Urban Environments.” https://www.recyclingtoday.com/
- European Commission. (2024). “Single-Use Plastics Directive.” https://ec.europa.eu/

No comment