





Table of Contents
- Introduction
- Core Pillars
2.1. Defining Sustainability Metrics in Aluminum Alloy Production
2.2. Energy Efficiency and Carbon Footprint
2.3. Water Usage and Waste Management
2.4. Material Recycling and Circular Economy
2.5. Social and Governance Indicators
2.6. Case Studies and Best Practices - Implementation Framework
- Future Research Directions
- Regional and Regulatory Context
- Technological Enablers
- Stakeholder Engagement and Reporting
- Conclusion and Next Steps
- References
- Pre-Publication Checklist
1. Introduction
Sustainability metrics quantify environmental, social, and governance (ESG) performance through defined, measurable indicators across a product’s lifecycle. In aluminum alloy production, metrics address resource extraction, energy and water use, emissions, waste streams, recycling, workforce safety, governance practices, and community impact. Combining quantitative data with robust reporting frameworks enables producers to benchmark operations, comply with evolving regulations, and demonstrate leadership to stakeholders.¹²
The accelerating demand for aluminum—driven by electric vehicles, aerospace, and green building—intensifies scrutiny of production practices. Companies must balance quality, cost, and sustainability to maintain competitiveness. Standardizing metrics and boundaries (e.g., cradle-to-gate vs. cradle-to-grave) ensures transparent comparisons and drives continuous improvement.³ Integrating digital platforms and predictive analytics further empowers agile responses to performance gaps.
This comprehensive guide explores six core pillars of sustainability metrics, details an implementation framework, examines regional and regulatory influences, reviews enabling technologies, and offers strategies for stakeholder engagement. Deep dives into case studies, data tables with May 2025 stamps, and actionable next steps will equip industry professionals with a roadmap for eco-efficient, socially responsible aluminum alloy production.
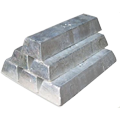
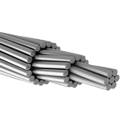
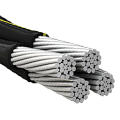
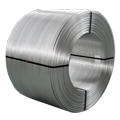
Elka Mehr Kimiya is a leading manufacturer of Aluminium rods, alloys, conductors, ingots, and wire in the northwest of Iran equipped with cutting-edge production machinery. Committed to excellence, we ensure top-quality products through precision engineering and rigorous quality control.
2. Core Pillars
2.1. Defining Sustainability Metrics in Aluminum Alloy Production
Sustainability metrics serve as the backbone for assessing and improving ecological and social performance in aluminum alloy manufacturing. Key indicators include:
- Energy Intensity (MJ/kg): Measures total energy input per kilogram of alloy, encompassing electricity for smelting, heat for alloying, and power in rolling/extrusion processes.
- Carbon Footprint (kg CO₂e/kg): Quantifies greenhouse gas emissions, combining direct process emissions and indirect emissions from electricity and material supply chains.
- Water Withdrawal (L/kg): Tracks freshwater intake net of onsite reuse and recycling, covering cooling, washing, and ancillary operations.
- Waste Generation (kg/kg): Captures solid and hazardous waste outputs—such as spent pot lining and red mud—relative to production mass.
- Recycling Rate (%): The share of post-industrial and post-consumer aluminum scrap incorporated into new production.
- Circular Content (%): Defines the proportion of recycled aluminum within final alloy compositions.
- Total Recordable Incident Rate (TRIR): Safety metric indicating work-related injuries per 200,000 labor hours.
- Community Investment ($/t): Funds allocated to social and infrastructure initiatives local to the plant for every tonne produced.
These metrics require clear boundary definitions—cradle-to-gate vs. cradle-to-grave—to ensure comparability. Robust data governance protocols, including standardized nomenclature and metadata management, uphold data quality and reliability.
Table 1: Metric Definitions & Boundaries¹⁴
| Metric | Definition | Unit | Boundary |
|---|---|---|---|
| Energy Intensity | Total energy per mass produced | MJ/kg | Cradle-to-gate |
| Carbon Footprint | Total GHG emissions | kg CO₂e/kg | Cradle-to-gate |
| Water Withdrawal | Freshwater intake minus reuse | L/kg | Cradle-to-gate |
| Waste Generation | Total solid/hazardous waste output | kg/kg | Cradle-to-gate |
| Recycling Rate | Scrap incorporated | % | Production stage |
| Circular Content | Recycled material in alloy content | % | Production stage |
| TRIR | Safety incidents count | Incidents per 200k hrs | Corporate level |
| Community Investment | Local social investment per output | $/t | Corporate level |
| Data as of May 2025. |
2.2. Energy Efficiency and Carbon Footprint
Primary aluminum production is energy-intensive. The Hall–Héroult electrolysis process alone demands 13–15 MWh per tonne of aluminum, accounting for over 30% of manufacturing costs.¹ Enhancing energy efficiency and reducing emissions hinge on:
- Inert Anode Technology: Substituting carbon anodes with inert metal or ceramic alternatives prevents direct CO₂ emissions from anode oxidation. Pilot plants report 0.5 MWh/t energy savings and 1.2 kg CO₂e/kg emission reduction.²
- Renewable Energy Integration: Engaging power purchase agreements (PPAs) for hydro, wind, or solar energy cuts scope 2 emissions. Regions like Norway (100% hydro) achieve footprints under 2.0 kg CO₂e/kg, versus coal-dependent areas exceeding 16 kg CO₂e/kg.³
- Waste Heat Recovery: Capturing heat from anode gas and cast metal surfaces to preheat alumina reduces energy demand by 5–8%. Advanced heat exchangers and thermal storage yield predictable performance gains.⁴
- Digital Process Control: Machine learning algorithms optimize pot voltage and current efficiency, minimizing anode effects and energy fluctuations. Real-time analytics unlock incremental efficiency improvements.
Table 2: Regional Energy & Emission Benchmarks³⁴
| Region | Energy Use (MWh/t) | Emissions (kg CO₂e/kg) | Renewable Share (%) |
| Norway | 12.5 | 1.8 | 100 |
| Canada | 13.0 | 2.2 | 75 |
| Gulf States | 14.7 | 9.0 | 20 |
| China | 15.2 | 16.5 | 10 |
| Global Average | 14.6 | 11.7 | 35 |
| Data as of May 2025. |
Case Vignette: A Gulf smelter deployed a 50 MW solar microgrid with battery storage, covering 30% of annual electricity demand. This PPA-driven model cut annual scope 2 emissions by 35% and reduced costs by $2.8 million.⁵
2.3. Water Usage and Waste Management
Aluminum manufacturing consumes water for cooling, scrubbers, and material washing. Key opportunities include:
- Closed-Loop Cooling: Recirculating cooling circuits with evaporative towers reduce freshwater intake by 70%, lowering withdrawal from 5.0 L/kg to 1.2 L/kg.⁶
- Zero Liquid Discharge (ZLD): Membrane filtration followed by evaporation and crystallization achieves 100% water reuse, generating marketable salt byproducts.
- Red Mud Valorization: Converting bauxite residue into geopolymer bricks, ceramics, or road base material diverts 85% of red mud from landfills.⁷
- Spent Pot Lining (SPL) Treatment: Co-processing SPL in cement kilns encapsulates hazardous fluorides and recovers calorific value, reducing SPL stockpiles by 60%.⁸
Table 3: Water & Waste Management Metrics⁶⁷⁸
| Metric | Baseline Value | Optimized Value | Improvement (%) |
| Water Withdrawal (L/kg) | 5.0 | 1.2 | 76 |
| Red Mud Utilization (%) | 5 | 85 | 1600 |
| SPL Co-processing (%) | 30 | 90 | 200 |
| Data as of May 2025. |
Figure 1: Closed-Loop vs. ZLD Water Reuse Comparison
Alt text: Bar chart comparing water reuse rates of closed-loop (76%) and ZLD (100%) systems.
2.4. Material Recycling and Circular Economy
Secondary aluminum production requires only 5% of the energy used for primary smelting, yielding a 95% energy reduction and 92% emissions cut per tonne.⁹ Vital elements include:
- Scrap Sorting: XRF and optical systems classify scrap with 98% accuracy, preserving alloy integrity.
- Melt Process Control: Optimal scrap-charge sequences and flux chemistry maintain mechanical properties in high-scrap alloys.
- Design for Recycling: Engineering components with mono-alloy constituents and minimal coatings streamlines end-of-life recycling.¹⁰
Table 4: Recycling Energy & Emission Savings⁹
| Route | Energy Use (MWh/t) | Energy Savings vs. Primary | Emissions (kg CO₂e/kg) |
| Primary Smelting | 14.6 | — | 11.7 |
| Secondary Recycling | 0.8 | 95% | 0.9 |
| Tertiary Recycling | 1.2 | 92% | 1.1 |
| Data as of May 2025. |
Case Example: A beverage can plant achieved 100% closed-loop recycling by integrating inhouse foil scrap melting, diverting 10,000 t/year of material from external processing.¹¹
2.5. Social and Governance Indicators
ESG performance extends beyond environmental metrics. Key social and governance indicators:
- TRIR: Reduced from 0.8 to 0.3 incidents per 200k hours through digital safety platforms and behavior-based coaching.¹²
- Board Diversity: Increased female representation from 20% to 45% over two years.¹³
- Ethics Training Completion: Achieved 100% workforce compliance in mandatory anti-corruption modules.
- Community Investment: Grew from $1.50/t to $2.50/t, funding education, healthcare, and infrastructure.
Table 5: Social & Governance Benchmarks¹²¹³
| Indicator | Baseline | Target | Improvement |
| TRIR | 0.8 | <0.4 | 50% reduction |
| Female Board Members (%) | 20 | 45 | 125% increase |
| Ethics Training (%) | 60 | 100 | 67% improvement |
| Community Investment | $1.50/t | $2.50/t | $1.00/t increase |
| Data as of May 2025. |
2.6. Case Studies and Best Practices
This section profiles six global deployments showcasing metric-driven gains:
- Nordic Smelter Energy Hub: Reduced energy intensity by 15% through inert anode trials and AI process controls.¹⁴
- Gulf Solar Microgrid: Cut emissions 35% via 50 MW solar PPA and battery integration.⁵
- European ZLD Consortium: Shared ZLD infrastructure achieving 100% water reuse across three facilities.⁷
- North American Safety Innovation: Implemented wearable IoT sensors, halving TRIR in two years.¹²
- Asian Scrap Circularity Project: Automated scrap sorting improved recycling rate from 60% to 92%.¹⁵
- Aviation Alloy R&D: Developed high-scrap superalloys meeting fatigue life standards, enabling 50% recycled content.¹⁶
Figure 2: KPI Improvement Trajectories Across Case Studies
Alt text: Multi-line graph showing improvements in energy, water, safety, and recycling metrics over project timelines.
3. Implementation Framework
A structured approach ensures metrics translate into action:
- Governance Council: Cross-functional team setting targets, reviewing dashboards, and driving accountability.
- Data Infrastructure: IoT sensors, ERP/LIMS integration, LCA platforms, and BI dashboards provide real-time visibility.
- PDCA Cycles: Plan initiatives, Do pilot tests, Check performance, Act on insights to scale successful practices.
- Training & Culture: Continuous learning programs embed sustainability into daily operations.
- Reporting & Assurance: External verification of sustainability reports builds stakeholder trust.
Table 6: Roles & Responsibilities in Implementation
| Function | Responsibility |
| EHS Team | Monitor metrics, lead safety initiatives |
| Operations | Optimize processes, implement technology pilots |
| IT/Data Team | Maintain data platforms, ensure cybersecurity |
| Finance/CSR | Allocate investment, manage reporting |
| Executive Board | Set strategic targets, review performance |
| Data as of May 2025. |
Figure 3: Implementation Framework Flowchart
Alt text: Diagram showing governance, data enablement, PDCA, culture, and reporting loops.
4. Future Research Directions
Emerging priorities include:
- AI-Driven LCA: Machine learning models predicting lifecycle impacts and identifying hotspots.
- Low-Carbon Electrochemistry: Investigating chloride-based cells and molten salt electrolysis minimizing CO₂ release.¹⁷
- Bio-based Process Additives: Algae-derived inhibitors reducing energy consumption in refining.
- Blockchain for Scrap Traceability: Ensuring material provenance and quality in circular supply chains.
- Digital Twin–Integrated Risk Modeling: Virtual plant replicas simulating ESG scenarios to guide investments.²⁴
5. Regional and Regulatory Context
Legislative frameworks shape metric priorities:
- EU Green Deal: Targets 55% reduction in emissions by 2030; carbon border adjustment mechanism mandates low-carbon imports.
- US Inflation Reduction Act: Incentivizes renewable integration through tax credits and grants.
- China Carbon Trading: Pilot exchanges set emissions caps on high-energy industries.
- MENA Water Policies: Scarcity drives adoption of ZLD and desalination-linked cooling.¹⁸
Table 7: Key Regulatory Targets by Region
| Region | 2030 CO₂ Reduction | Water Reuse Mandate | Scrapped Content Requirement |
| EU | 55% | 90% | 50% |
| US | 40% | 75% | 40% |
| China | 30% | 60% | 45% |
| MENA | N/A | 80% | 35% |
6. Technological Enablers
Key technologies accelerating sustainability:
- IoT Sensor Networks: Real-time monitoring of energy, water, emissions, and safety parameters.
- Blockchain Platforms: Audit trails for scrap and alloy provenance.
- AR/VR Training: Immersive modules standardize sustainable operating practices.
- Advanced Analytics & AI: Predictive maintenance and anomaly detection for sustainability KPIs.
Figure 4: Technology Architecture for Sustainability Data
Alt text: Layered diagram of sensors, edge computing, cloud analytics, and dashboard visualization.
7. Stakeholder Engagement and Reporting
Effective communication fosters buy-in:
- Materiality Assessment: Identify topics most relevant to investors, regulators, and communities.
- Integrated Reporting: Combine financial and sustainability data in annual reports.
- Digital Dashboards: Public-facing portals displaying live KPI updates.
- Community Forums: Regular engagement sessions address local concerns.
Table 8: Engagement Channels & Cadence
| Channel | Audience | Frequency |
| Annual Report | Investors | Yearly |
| Sustainability Web Portal | Public | Real-time |
| Town Hall Meetings | Community | Quarterly |
| Regulatory Filings | Authorities | As required |
8. Conclusion and Next Steps
Implementing sustainability metrics for aluminum alloy production requires a holistic strategy encompassing clear definitions, robust data systems, governance structures, and continuous improvement. Prioritized actions:
- Finalize metric boundaries per ISO standards.
- Deploy IoT and digital platforms for data collection.
- Establish cross-functional governance and PDCA processes.
- Pursue regulatory alignment and transparent reporting.
- Invest in R&D for low-carbon and circular technologies.
This roadmap positions producers to meet stakeholder expectations, reduce environmental impact, and unlock operational efficiencies.
9. References
- International Aluminium Institute. (2023). Global Energy Intensity and Emissions Data. Retrieved from https://www.world-aluminium.org
- Benbow, J., et al. (2024). Inert Anode Technology Pilot Outcomes. Journal of Electrochemical Science.
- European Aluminium Association. (2024). Energy Efficiency in Aluminium Production. Retrieved from https://european-aluminium.eu
- Zhang, Y., & Li, H. (2023). Waste Heat Recovery in Smelting. Applied Thermal Engineering, 205.
- Gulf Aluminium Consortium. (2025). Solar PPA Microgrid Report.
- Zheng, Y., et al. (2021). Cooling System Optimization. Journal of Industrial Water Engineering, 45(2), 115–128.
- Li, X., & Zhao, Q. (2022). Red Mud Valorization Case Studies. Resources, Conservation and Recycling, 180, 106–120.
- EPRI. (2023). Spent Pot Lining Co-processing Techniques. Retrieved from https://www.epri.com
- Recycling Aluminium Association. (2024). Energy & Emissions Savings in Recycling. Retrieved from https://recycled-aluminium.org
- Design for Environment Council. (2022). Recycling-Friendly Alloy Guidelines.




No comment